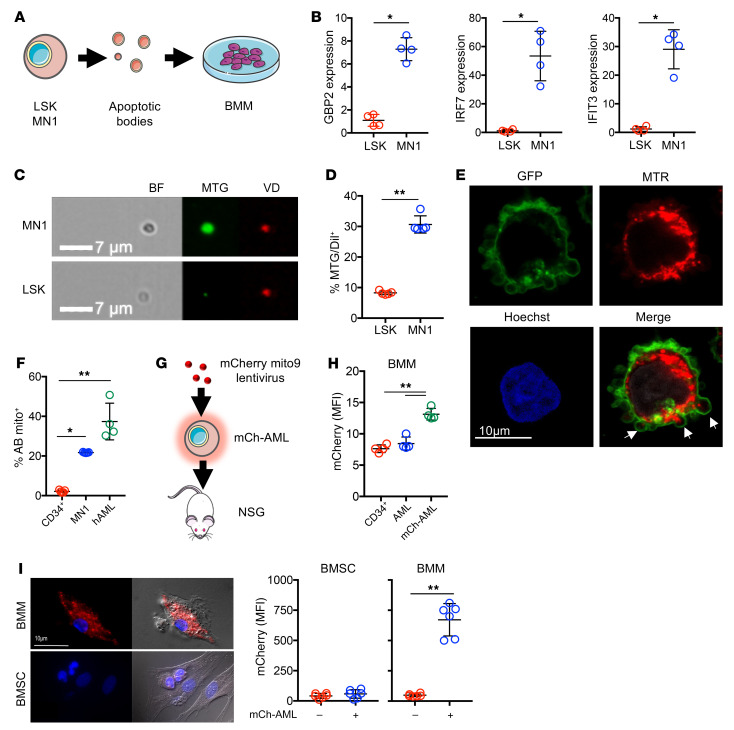
Figure 5. AML-derived ABs contain mitochondria that are processed by BMMs.
(A) ABs were isolated from MN1 and nonmalignant LSK cells and cultured with BMMs from C57/BL6 mice for 24 hours, and RNA was extracted for qPCR analysis. (B) Relative gene expression of Gbp2, Irf7, and Ifit3 in BMMs cultured with MN1 and LSK ABs (n = 5). (C) Representative images of nonmalignant LSK and MN1 cells stained with MitoTracker Green (MTG) or VybrantDil (VD). ABs were isolated and analyzed via image flow cytometry. Scale bar: 7 μm. (D) Percentage of ABs from LSK and MN1 cells that were positive for MitoTracker Green and VybrantDil (n = 5). (E) Representative confocal microscopy images of human AML cells that were transduced with a GFP membrane virus and stained with MitoTracker Red (MTR) and Hoechst. Arrows indicate blebs containing mitochondria. Scale bar: 10 μm. (F) Nonmalignant CD34, MN1, and human AML cells were stained with MitoTracker Red before isolating the ABs and analyzing them via flow cytometry for the percentage of ABs containing MitoTracker Red (mito+) (n = 5). (G) Schematic diagram of the experimental design. Primary AML cells were transduced with rLV.EF1.mCherry-Mito9 lentivirus (mCh-AML) and injected into NSG mice and left for 35 days (n = 3). (H) BM was extracted and BMMs were analyzed by flow cytometry for mCherry fluorescence (MFI). (I) mCh-AML cells were cocultured with BMSCs and BMMs and analyzed by microscopy for mitochondria uptake, as determined by mCherry MFI (n = 25). Scale bar: 10 μm. Data indicate the mean ± SD. *P < 0.05 and **P < 0.01, by Mann-Whitney U test (B, D, and I) and Kruskal-Wallis test (F and H).

