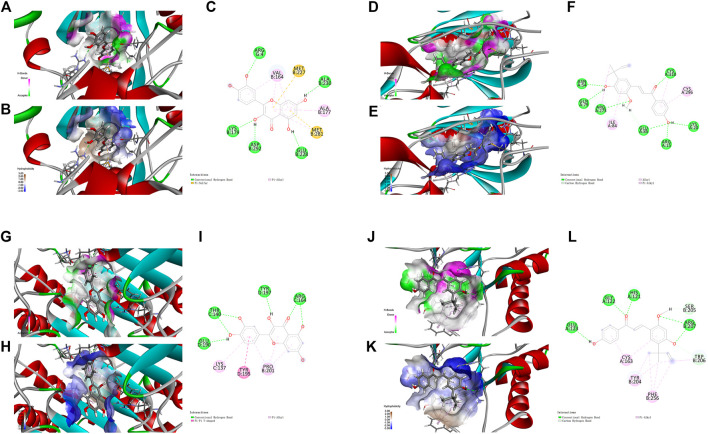
FIGURE 5.
Molecular docking analysis showing bond pattern of Akt1 and quercetin (A–C), kaempferol (D–F); Caspase-3 binding to quercetin (G–I), kaempferol (J–L). (A,D,G,J): Areas of the donor and acceptor of hydrogen bond (H-bond). (B,E,H,K): Areas of hydrophobicity. (C,F,I,L): Two dimensional patterns of bond.

