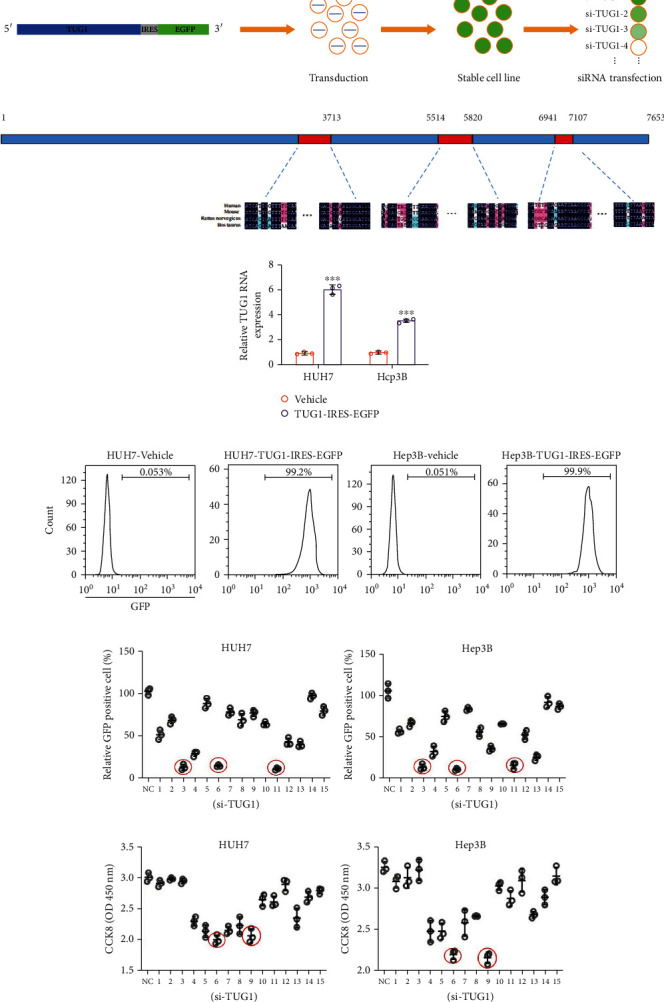
Figure 4.

The screen of siRNAs targeting TUG1. (a) Schematic diagram of the siRNA screen method and cell line construction. (b) Schematic diagram of the TUG1 conserved region. (c) TUG1 expression in HUH7-TUG1-IRES-EGFP and Hep3B-TUG1-IRES-EGFP cells. (d) Flow cytometry results of EGFP positive rate in HUH7-TUG1-IRES-EGFP and Hep3B-TUG1-IRES-EGFP cells. The screen of siRNAs targeting TUG1 in (e) HUH7-TUG1-IRES-EGFP and (f) Hep3B-TUG1-IRES-EGFP (F) cells by flow cytometry. The screen of siRNAs targeting TUG1 in (g) HUH7 and (h) Hep3B cells by CCK8. The data are presented as the means ± SD, n = 3 replicates in (c and e–h). ∗P < 0.05, ∗∗P < 0.01, ∗∗∗P < 0.005. S15: Siglec-15.
