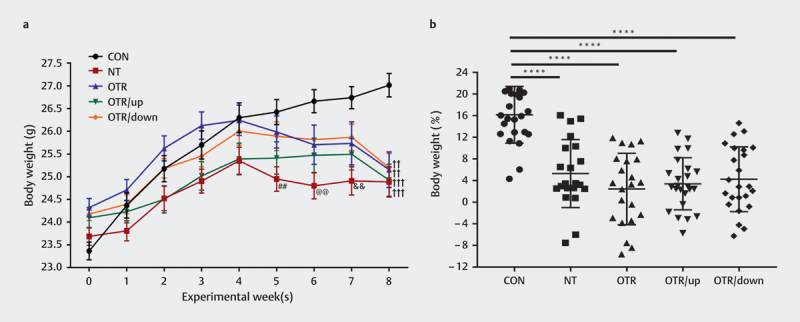
Fig. 1.

Changes in the body weight (g) of all experimental groups (a) . Percent changes in body weight at the end of the 8-week treadmill protocol (b) . The data represent the means±SEMs of n=16. ## Statistically significant (P<0.01) difference compared with the CON group in week 5; @@ statistically significant (P<0.01) difference compared with the CON group in week 6; && statistically significant (P<0.01) difference compared with the CON group in week 7; †† statistically significant (P<0.01) difference compared with the CON group in week 8; ††† statistically significant (P<0.001) difference compared with the CON group in week 8; ****statistically significant (P<0.0001) difference compared with the CON group.
