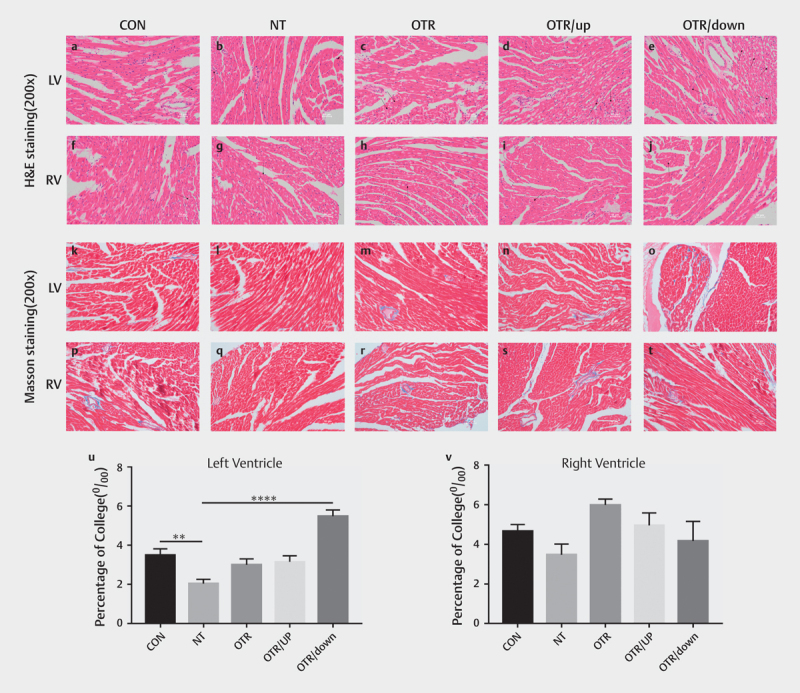
Fig. 3.

Representative images of H&E staining (200x) of the left ventricular myocardium (a–e) and right ventricular myocardium (f–j) from the five experimental groups. Masson’s trichrome staining (200x) of the left ventricular myocardium (k–o) and right ventricular myocardium (p–t) tissue sections from the five experimental groups. Scale bars represent 50 μm. Quantitative analysis of Masson’s trichrome staining for fibrosis in the left ventricular myocardium (u) . Quantitative analysis of Masson’s trichrome staining for fibrosis in the right ventricular myocardium (v) . The data represent the means±SEMs of n=6. **Statistically significant (P<0.01); ****statistically significant (P<0.0001).
