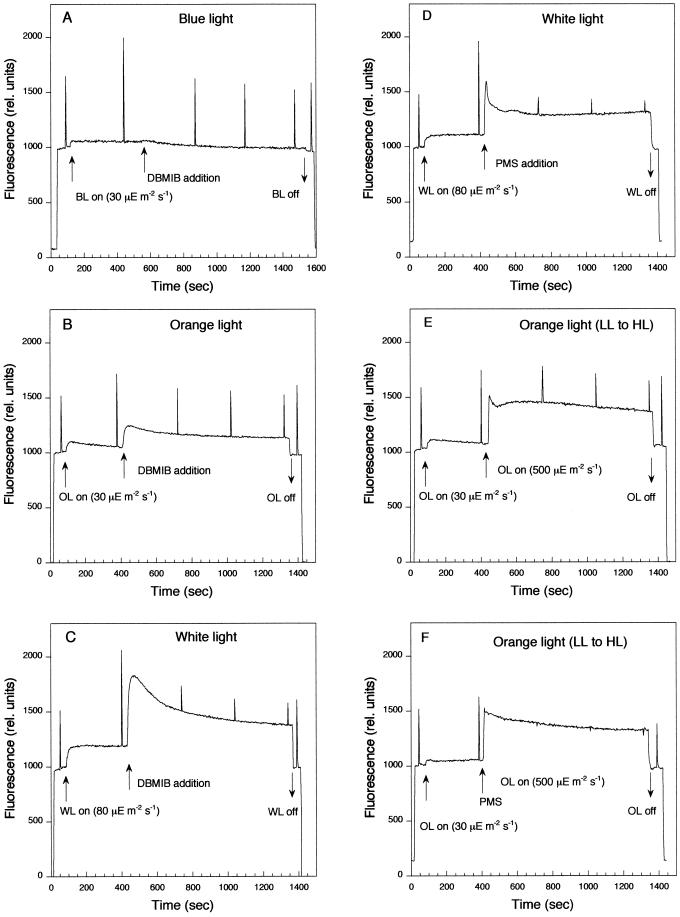
Figure 5.
Measurements of fluorescence yield by a PAM fluorometer during different types of illumination in wild-type cells. Dark-adapted cells for 5 min were illuminated with blue (30 μE m−2 s−1) (A), orange (30 μE m−2 s−1) (B, E, and F), or white (80 μE m−2 s−1) (C and D) light. After 5-min incubation, 15 μm DBMIB (A–C) or 50 μm PMS (D and F) was added. E and F, The cells after 5 min of incubation under low-light intensities of orange light (30 μE m−2 s−1) were transferred to higher intensities of orange light (500 μE m−2 s−1). PMS was added just before the cell transfer. Saturating pulses (3,200 μE m−2 s−1, 800-ms duration) were applied to assess Fm′. The pulses were separated by 100 s. Chl concentration, 15 μg mL−1.

