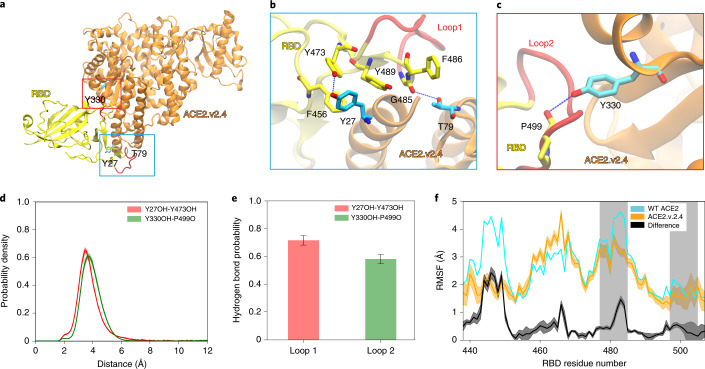
Fig. 2. Mutations in ACE2.v2.4 form stabilizing interactions with RBD loops.
a–c, Based on simulations of RBD-bound ACE2, new polar interactions were identified between the ACE2.v2.4 (orange) and RBD (yellow) loops (red) (a). ACE2 mutations are presented as sticks colored cyan with nearby RBD residues as sticks colored yellow. New polar interactions between ACE2.v2.4 and RBD loops 1 (b) and 2 (c) are indicated by the dotted blue lines. d, MSM-weighted distance distributions of newly formed hydrogen bonds. For each interacting pair, the ACE2.v2.4 residue is listed first and the RBD residue is listed second. e, Probabilities for stable hydrogen bond interactions using a 4-Å distance criterion between accepter and donor. f, Root mean square fluctuation (RMSF) of RBD residues when bound to WT (cyan) or v2.4 (orange) ACE2 receptors. The RBD regions that interface with ACE2 are shaded gray. The absolute difference in RMSF between WT and v2.4 proteins is shown in black. Distance distributions, hydrogen bond probabilities and RMSF calculations were based on 40,000 frames from the simulations. Frames were selected based on the MSM stationary probability to represent the entire conformational ensemble. The error bars represent the 95% confidence intervals calculated from 20 bootstrapped samples.

