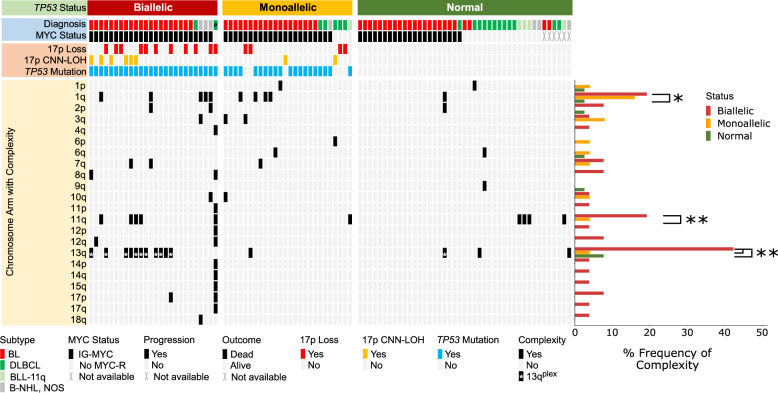
Fig. 2. A pattern of complex chromosomal abnormalities in paediatric B-NHL is associated with TP53 status.
Oncoplot showing TP53 status (upper panel) and associated complex chromosomes (lower panel). Histogram displaying the frequency of complex abnormalities of each chromosome arm in biallelic, monoallelic and TP53 normal groups. As a diagnosis of BLL-11q is determined by the presence of a complex 11q rearrangement, these five cases were excluded from this analysis. TP53 Biallelic with 1q complexity vs TP53 Normal with 1q complexity, p = 0.026; TP53 Biallelic with 11q complexity vs TP53 Normal with 11q complexity, p = 0.006. TP53 Biallelic with 13q complexity vs TP53 Normal with 13q complexity, p = 0.001; TP53 Biallelic with 13q complexity vs TP53 Monoallelic with 13q complexity, p = 0.002. Fisher’s Exact test * = p < 0.05, ** = p < 0.01; # Li-Fraumeni syndrome case.

