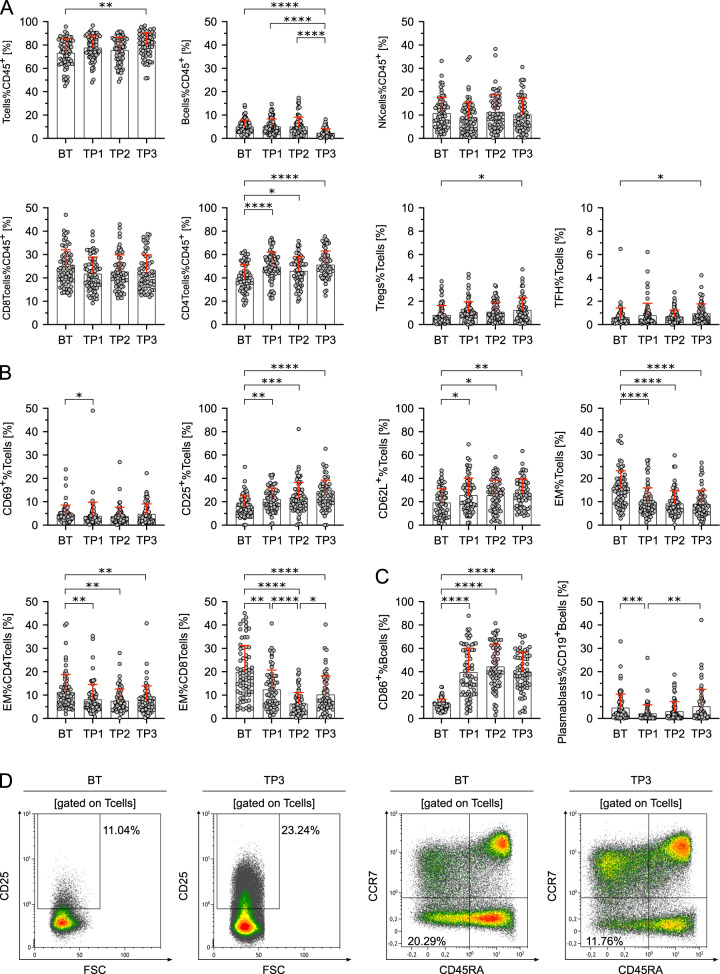
Fig. 3. The observed effects of HL on composition and maturation of peripheral lymphocytes are reversed following anti-PD1 therapy.
A Lymphocyte subsets in percent of CD45+ lymphocytes or T cells in peripheral blood mononuclear cells of Hodgkin lymphoma (HL) patients before therapy (BT, n = 72), sequential samples obtained 1 and 8 weeks after treatment initiation (TP1, n = 72 and TP2, n = 68) and after completion of systemic treatment (TP3, n = 62). Samples containing ≤100 CD45+ cells were excluded. B Differences in T-cell activation (CD69+%Tcells, CD25+%Tcells, and CD62L+%Tcells) and T-cell differentiation (CCR7−CD45RA− effector memory (EM) T cells) of HL patients before (BT) and during the course of therapy (TP1-TP3). C Differences in B-cell activation (CD86+%Bcells) and B-cell differentiation (plasmablasts%Bcells) of HL patients before therapy (BT) and during the course of therapy (TP1–TP3). D Representative flow cytometry plots of peripheral blood mononuclear cells obtained from a HL patient before therapy (BT) and after completion of treatment (TP3). CD25+ activated T cells (left two plots) and CCR7−CD45RA− effector-memory T cells are shown (right two plots). Significant differences calculated by nonparametric Kruskal–Wallis test followed by Dunn’s post hoc test (A–C) are indicated by asterisks. *p ≤ 0.05, **p ≤ 0.01, ***p ≤ 0.001, ****p ≤ 0.0001. When appropriate, mean ± SD is indicated.

