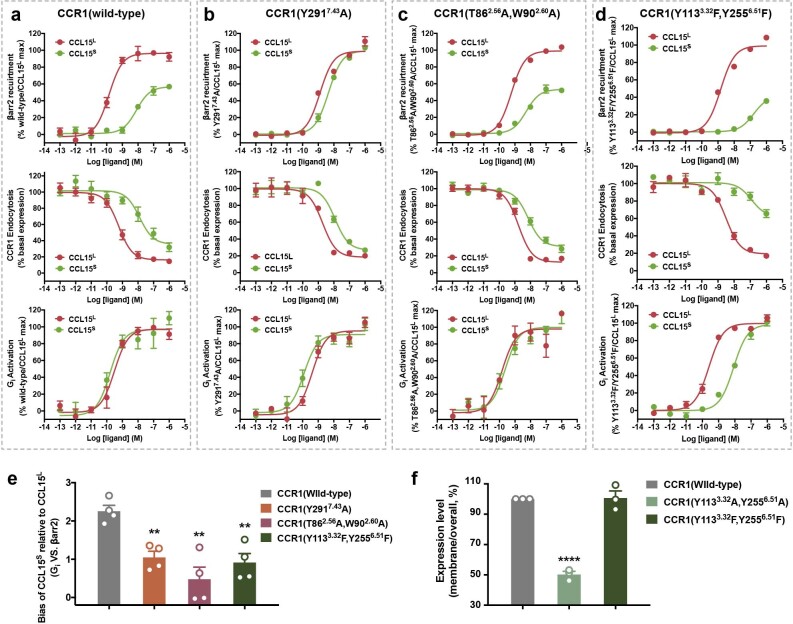
Extended Data Fig. 10. Effects of mutations in biased signaling.
a-d, Dose-response curves of β-arrestin recruitment (upper), endocytosis (middle) and Gi activation (bottom) on CCR1(wild-type) (a), CCR1(Y2917.43A) (b), CCR1(T862.56A/W902.60A) (c) and CCR1(Y1133.32F/Y2556.51F) (d) induced by CCL15L and CCL15S [CCL15(30-92)]. N= three independent experiments for the endocytosis on CCR1(Y2917.43A) and CCR1(Y1133.32F/Y2556.51F), performed with single replicates. N= four independent experiments for the others, performed with single replicates. e, Biased factors of CCL15S [CCL15(30-92)] on wild-type and mutational CCR1s relative to CCL15L. N= four independent experiments, performed with single replicates. The asterisk symbols indicated statistically significant difference (P =0.0072, P =0.0004, and P=0.0034 from left to right, **P <0.01) for mutants vs. wild-type CCR1 as determined by one-way ANOVA. f, The proportion of membrane to total expression of receptors. N= three independent experiments, performed with single replicates. P values were calculated using two-tailed Student’s t-test. The asterisk symbols indicated statistically significant difference (P <0.001, and P=0.9789 from left to right, ****P <0.0001) for mutants vs. wild-type CCR1. In a-f, all data were shown as mean±SEM.

