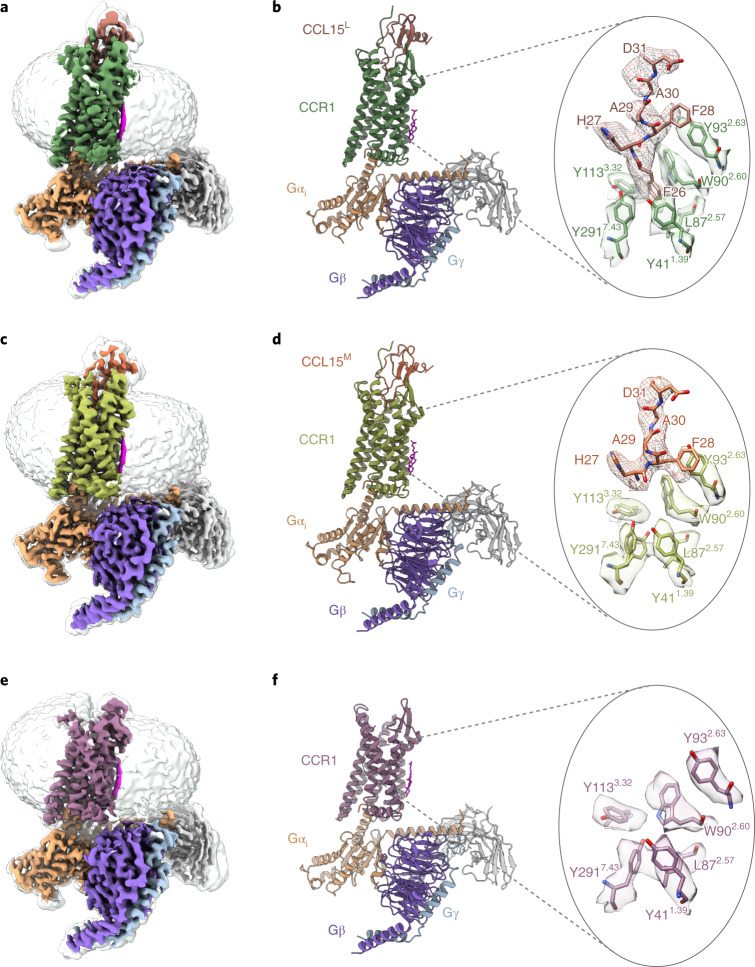
Fig. 2. Cryo-EM structures of CCR1–Gi complexes in the CCL15L-, CCL15M- bound and apo states.
a,c,e, Cryo-EM density maps of CCR1-Gi complexes bound to CCL15L (a), CCL15M(c) and in the apo state (e). b,d,f, Models of CCR1–Gi complexes in three states (left). Sandy brown, Gαi; purple, Gβ; sky blue, Gγ; gray, scFv16 and green, CCL15L-bound CCR1 (b); brown, CCL15L (b); dark khaki, CCL15M-bound CCR1 (d); orange, CCL15M (d) and plum, apo-state CCR1. Cryo-EM maps and atomic resolution models showing the binding pockets in the 7TM domains of two CCR1–Gi complexes (right). Atomic models and EM density shown as sticks and surfaces, respectively. EM density of CCL15L and CCL15M shown as a mesh.

