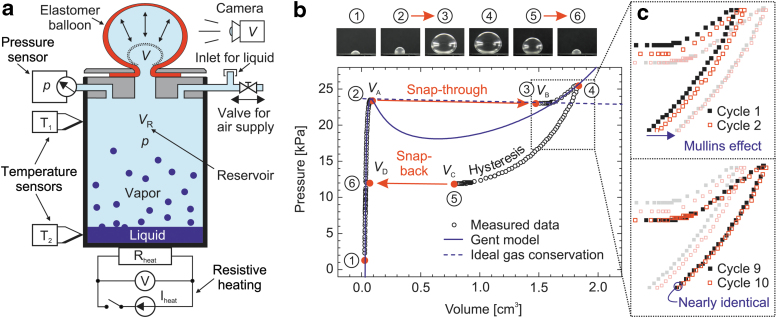
FIG. 2.
(a) Schematic view of the experimental setup, including the clamped elastomer membrane after triggering the instability (Balloon state before the snap-through is indicated by a dotted curve), the camera for volume analysis, the pressure and temperature sensors, the resistive heating, the valve for supplying pressurized air, and the inlet to add liquid into the reservoir. (b) Measured data in the pressure-volume plane representing a full inflation and deflation cycle. The curve is traversed clockwise, starting and ending at state 1. Photos are taken at states 1 to 6. The snap-through and snap-back instabilities with the jumps in volume from states 2 to 3 and states 5 to 6 are indicated by arrows. The solid N-shaped curve is a theoretical fit according to the Gent model in Equations (1) and (2), and the dashed curve represents the ideal-gas conservation law for the enclosed air from Equation (4). (c) The detailed inset shows the change in behavior from the first to the 10th inflation/deflation cycle due to change in material properties.

