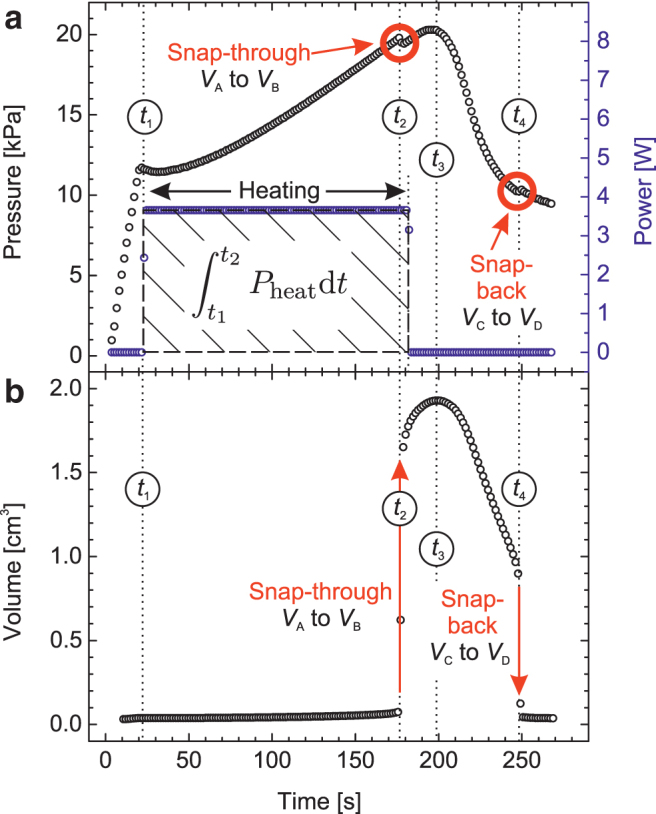
FIG. 3.

(a) Increase in the overall overpressure (left axis) upon resistive heating with the constant power P (right axis) triggering the snap-through instability at t2. Active cooling is started at t3 until the snap-back occurs at t4. (b) Accompanying change in balloon volume, calculated from the high-speed camera recording.
