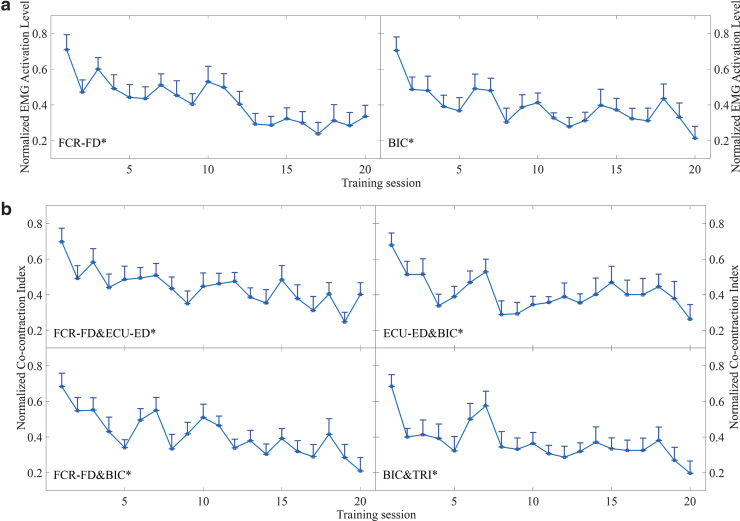
FIG. 10.
Variations in the EMG parameters recorded across the 20 training sessions: (a) the normalized EMG activation levels of the FCR-FD muscle union and BIC muscles during the bare hand evaluations and (b) the changes in the normalized CIs between the FCR-FD and ECU-ED muscle unions, the ECU-ED muscle union and the BIC muscles, the FCR-FD muscle union and BIC muscles, and the BIC and TRI muscle pair during the bare hand evaluations. The EMG parameter values are presented as mean ± twice the SE (error bar) for each session. The significant difference is indicated by “*” (p ≤ 0.05). CI, cocontraction index.

