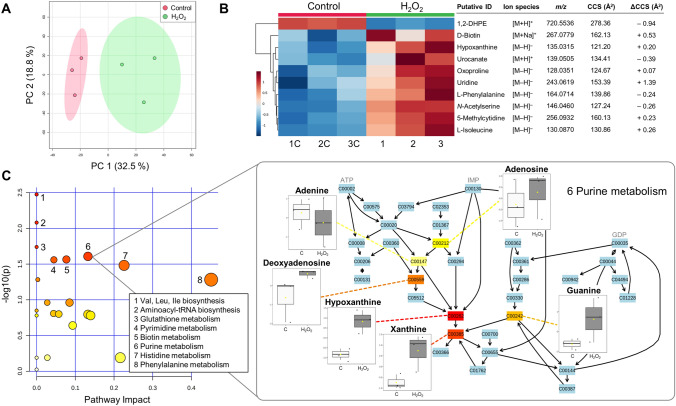
Fig. 5.
Metabolomics analysis of Rhizobium cells treated with 2 mM H2O2, as generated by MetaboAnalyst 5.0. A PCA scores plot indicating differences in metabolic profiles in H2O2-treated and control (untreated) samples (n = 3); B heat map depicting the top 10 most significantly affected metabolites after H2O2 treatment, annotated using the Unified CCS Compendium. The experimentally measured CCS values and ΔCCS values (measured CCS–Unified CCS Compendium) are presented; red indicates an increase and blue indicates a decrease, based on OD600-normalized and log-transformed intensities; C scatter plot of KEGG metabolic pathways in Rhizobium cells affected by H2O2 treatment, showing log p values from the pathway enrichment analysis (darker color indicates more significant changes within a pathway) and pathway impact values from the pathway topology analysis (the size of the node corresponds to the pathway impact score); significantly impacted pathways are annotated. KEGG purine metabolic pathway is focused upon as an example, depicting six putatively identified purine metabolites, out of which hypoxanthine and xanthine increased significantly after H2O2 treatment (color gradient from yellow to red indicates increasing significance values). The boxplots corresponding to the six metabolites represent the median ± IQR of OD600-normalized, log-transformed and auto-scaled intensities. 1,2-DHPE 1,2-Diheptadecanoyl-sn-glycero-3-phosphoethanolamine, ATP adenosine triphosphate, C control, GDP guanosine diphosphate, Ile L-Isoleucine, IMP inosine monophosphate, Leu L-Leucine, Val L-Valine

