Figure 3.
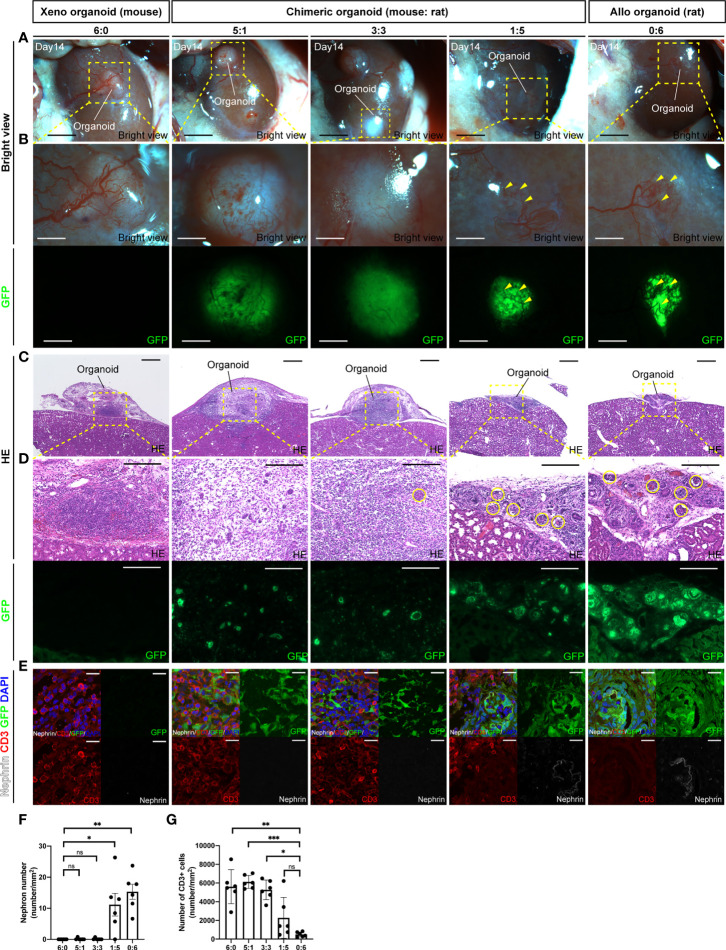
Chimeric renal organoids reduce xenograft rejection. (A) Images of chimeric renal organoids generated from single cells of mouse and rat fetal kidneys at different cell ratios at 14 days after transplantation into the renal capsule of SD rats under mild immunosuppression protocol (scale bar 1 mm). (B) Magnified image of (A). The 6:0 xenograft mouse renal organoids and the 5:1 and 3:3 chimeric renal organoids were white and enlarged, and the expression of GFP in the chimeric organoids was weak. The 1:5 chimeric kidney organoids showed the same vascular invasion of the recipient (yellow arrowhead) and strong GFP expression as the allogenic 0:6 rat renal organoids, the control (scale bars, upper column: 1 mm, lower column: 1 mm). (C) HE-stained images of each renal organoid. The 6:0 mouse renal organoids and 5:1 and 3:3 chimeric renal organoids were thickened and enlarged (scale bar 500 μm). (D) Magnified images of HE staining and GFP expression in each renal organoid. Both the xenogeneic mouse renal organoids and the chimeric renal organoids showed inflammatory cell infiltration and only a portion of the glomerulus remained (yellow circles). The 1:5 chimeric kidney organoids showed mild inflammatory cell infiltration and multiple glomeruli as in the control allogenic rat renal organoids (scale bars, upper column: 200 μm, lower column: 200 μm). (E) Images of CD3 immunostaining in each renal organoid. Xenograft 6:0 renal organoids, 3:3, and 5:1 chimeric renal organoids showed many CD3-positive cells and few glomerular structures. In 1:5 chimeric renal organoids, CD3-positive cells mainly infiltrated the region composed of GFP-negative heterologous mice, whereas renal tissue composed of GFP-positive rat cells showed less infiltration of CD3-positive cells (scale bar 20 μm). (F) The 1:5 chimeric renal organoids with a higher rat cell ratio had significantly higher glomerular counts compared to the 6:0 xenograft renal organoids (n = 6 in each group). Data are expressed as the mean ± standard error of the mean (Kruskal–Wallis test with post-hoc test). (G) The 1:5 chimeric renal organoids with a high rat cell ratio showed no significant difference in the number of CD3-positive cells compared to the 0:6 allogeneic renal organoids, but the 3:3, 5:1 chimeric renal organoids, and 6:0 xenograft renal organoids had significantly higher numbers of CD3-positive cells (n = 6 for each group). Data are expressed as the mean ± standard error of the mean (Kruskal–Wallis test with post-hoc test). *P < 0.05; **P < 0.01; ***P < 0.001; ns, not significant.

