FIGURE 3.

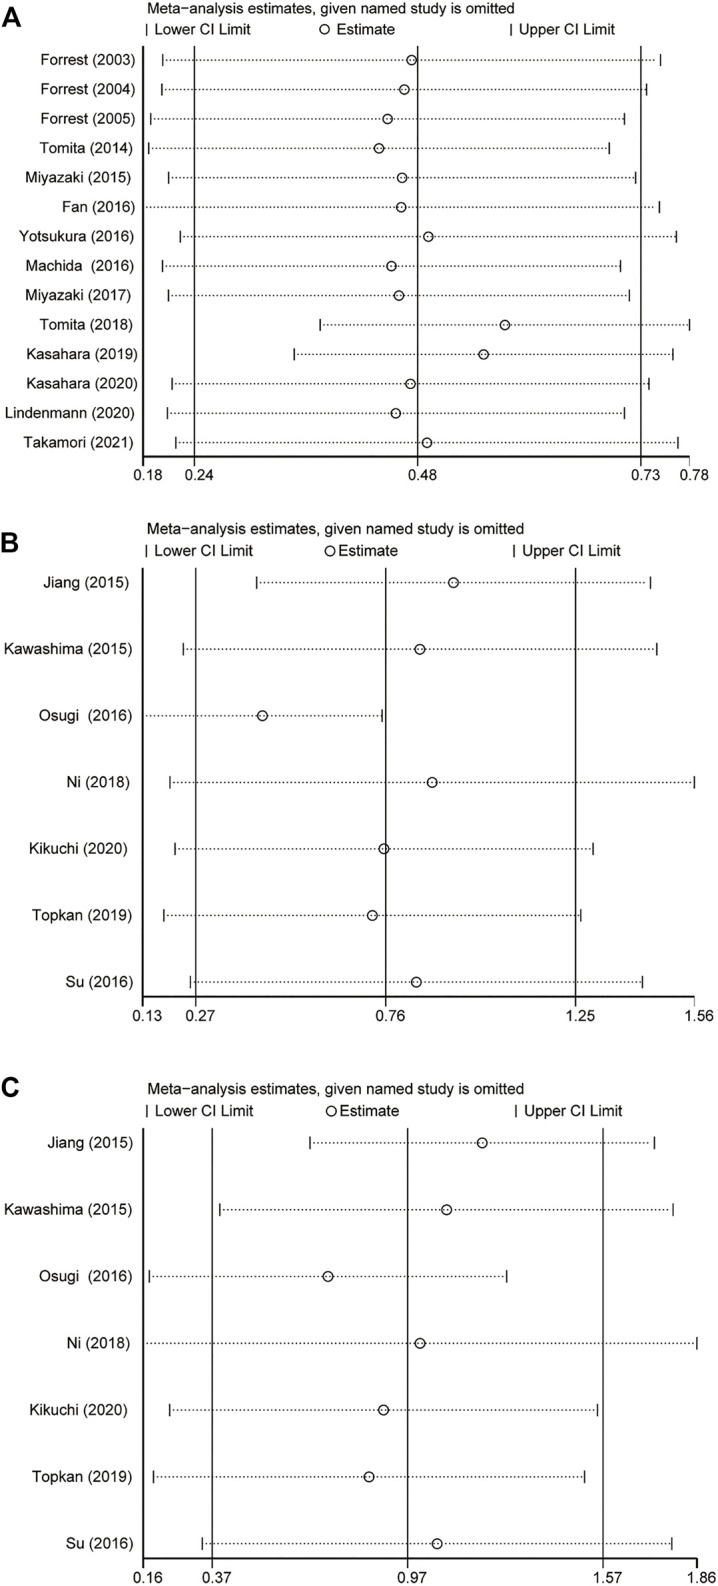
Result of sensitivity analyses by omitting one study in each turn. (A) GPS = 0 vs GPS = 1 or 2. (B) GPS = 0 vs GPS = 1. (C) GPS = 0 vs GPS = 2. GPS, Glasgow Prognostic Score; 95% CI, 95% Confidence Interval.

Result of sensitivity analyses by omitting one study in each turn. (A) GPS = 0 vs GPS = 1 or 2. (B) GPS = 0 vs GPS = 1. (C) GPS = 0 vs GPS = 2. GPS, Glasgow Prognostic Score; 95% CI, 95% Confidence Interval.