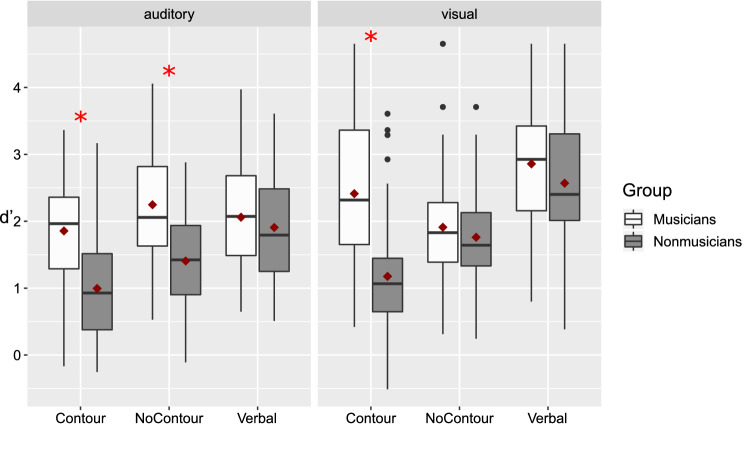
Fig. 2.
Accuracy (d’) for the memory task, separately for Modality, Category of Stimuli of stimuli and Group. Inside each box, the horizontal line indicates the median. The red diamond represents the mean. The edges of the box represent the first quartile (Q1) and the third quartile (Q3) (i.e., the 25th and the 75th percentiles). The interquartile (IQR) range is the height of the box (i.e., Q3—Q1). The upper whisker extends from Q3 to the largest value, no further than 1.5 * IQR from Q3. The lower whisker extends from Q1 to the smallest value no further than 1.5 * IQR from Q1. The black dots represent the data points inferior or superior to these cut-off values. The red asterisks represent the statistically significant differences between groups (post hoc tests)

