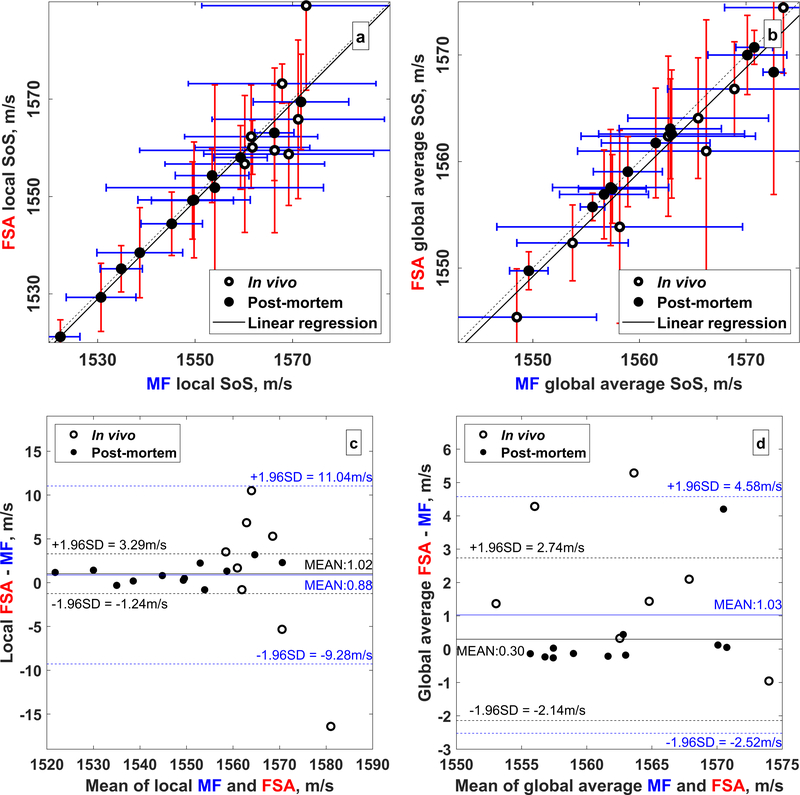
Figure 3.
Comparison of noninvasive speed of sound estimates from the FSA and MF pulse sequences. The empty and filled circles represent in vivo and postmortem estimates, respectively. (a) Local and (b) global average speed of sound estimates. The dashed line is the identity line and the solid black lines shows the linear regression. Only postmortem estimates were used to calculate the linear regression. (c) Bland-Altman plots of the local and (d) global average speed of sound estimates from the FSA and MF pulse sequences. The mean difference and 95% confidence limits are shown in blue for all 20 rats and in black for the 12 postmortem rats.

