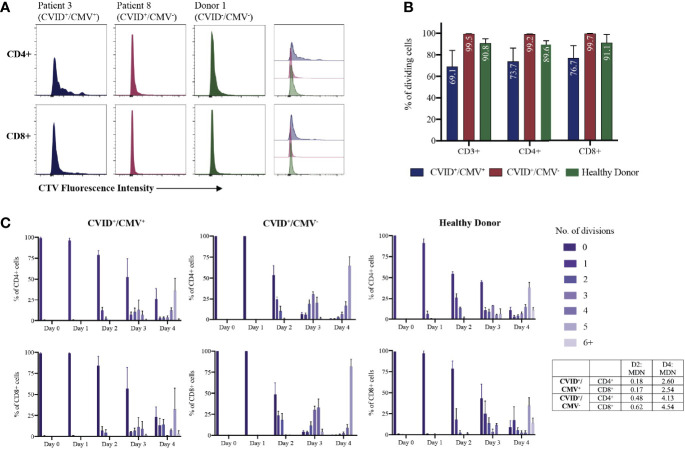
Figure 1.
T-cell proliferation to IL-2 + CD3/28 stimulation. (A) Individual examples of CD4+ and CD8+ T-cell proliferation at Day 4, determined by CellTrace Violet (CTV) dilution. (B) Proportions of dividing cells at Day 4 for each cohort, expressed as a percentage of total CD3+, CD4+ and CD8+ T-cells. Results presented as means and standard errors of the mean (SEM). (C) T-cell proliferation over time: number of CD4+ and CD8+ divisions at each time-point, expressed as a percentage of total CD4+ and CD8+ T-cells. Results presented as means and SEM for each cohort. MDN, Mean Division Number.

