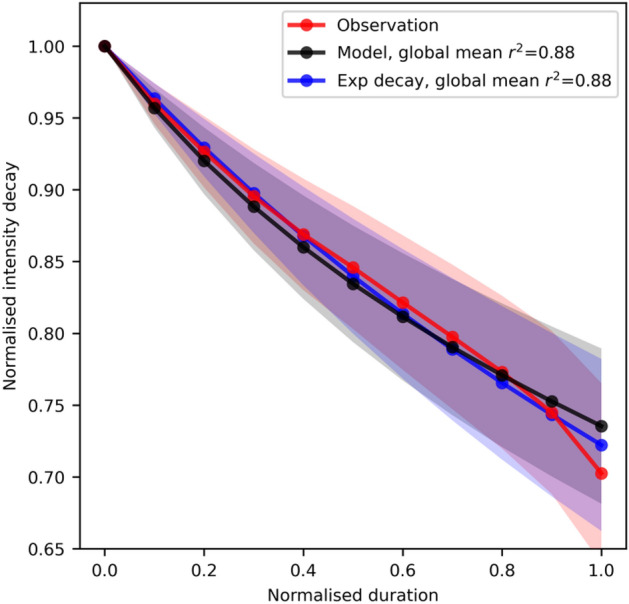
Figure 1.

Composite of intensity decay. The observed and fitted intensity decay from LMI to LI. The algebraic decay model [Eq. (3)] and an exponential decay [Eq. (5)] are used for the fit. Prior to compositing all TCs, each time series is normalised by its LMI and then interpolated onto the deciles of its duration. The shadings show one standard error of the mean at each decile point. Normalised duration time 0 and 1 represent the times of LMI and LI. The coefficient of determination, r2, are given in the legend for global TCs.
