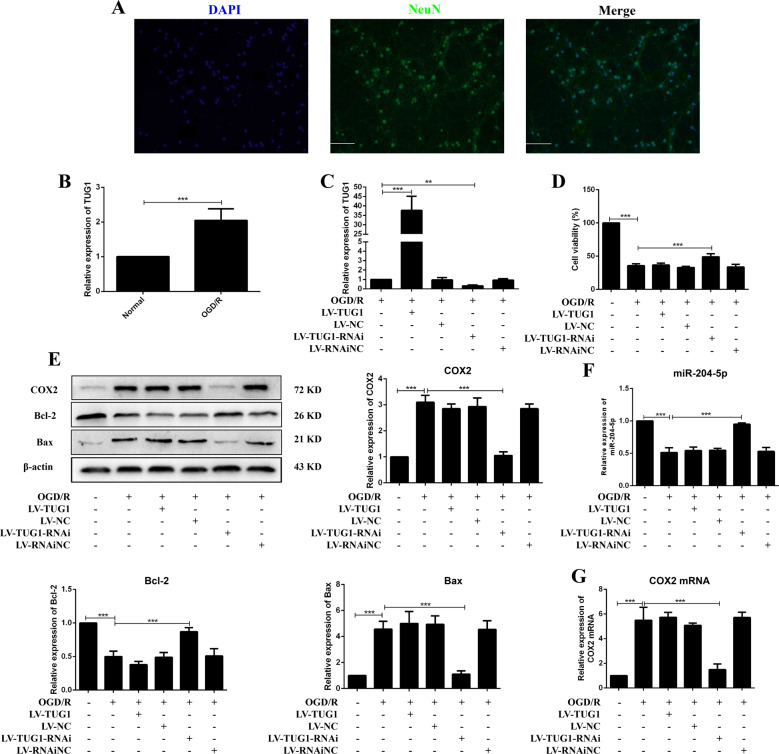
Fig. 4. Knockdown of TUG1 protected neurons from OGD/R injury.
A The identification of neurons was conducted by immunofluorescence. DAPI (blue), NeuN (green), 200×, scale bars = 100 μm. B Relative expression of TUG1 (n = 5). C The transfection efficiency of TUG1 (n = 5). D MTT assay (n = 6). E Relative protein levels of COX2, Bcl-2 and Bax in neurons (n = 5). Relative expression of miR-204-5p (F) and COX2 mRNA (G) in neurons (n = 5). Data are presented as the mean ± SD. **p < 0.01, ***p < 0.001.

