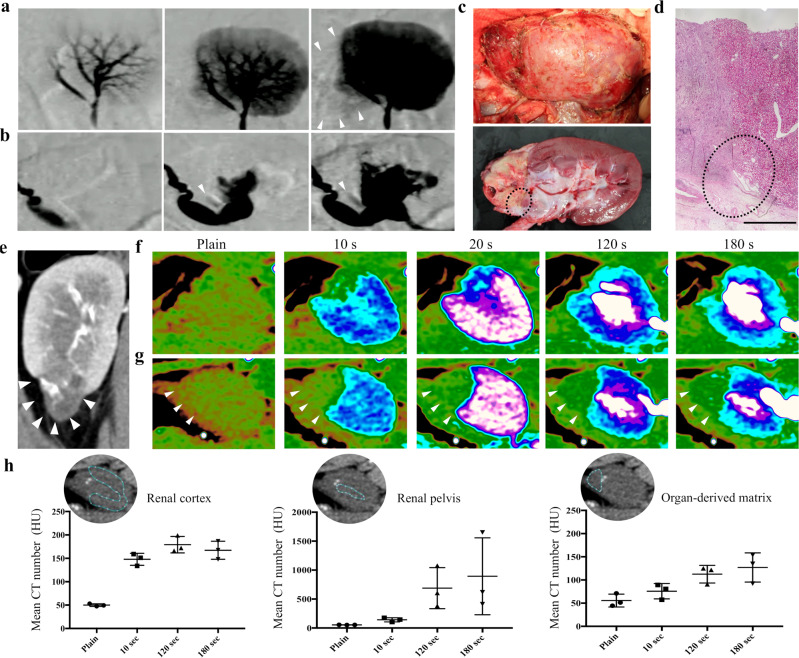
Fig. 6. CT, angiography, and urography of the organ-derived matrix.
a, b Time lapse of the a angiography and b urography images of the matrix-implanted kidney. The white arrowheads show the regions where the contrast was enhanced in the matrix. c Photographs of (top) a kidney containing an organ-derived matrix sutured to residual kidney before harvest 28 days post-implantation and (bottom) the harvested and sagittally resected kidney. The direction of the kidneys is identical to that of the kidneys imaged in Fig. 6a and b. d H&E staining of the area surrounded by the black-dotted circle in Fig. 6c. The area within the black-dotted circle in Fig. 6d shows the region where the matrix, residual kidney, and fused renal capsule are closely packed. Scale bar: 2 mm. e CT images of the matrix-implanted kidney. The white arrows show the matrix. f, g Time course of the CT scan images for f the PN kidney and g the matrix-implanted kidney. The white arrowheads show the matrix. h Time course of the mean CT number in the renal cortex, renal pelvis, and matrix in the implanted kidney. The CT number in ROI was estimated using OsiriX Lite. The white-dotted blue circles indicate ROI in the renal cortex, renal pelvis, and matrix. Bars represent the mean ± SD, (n = 3).

