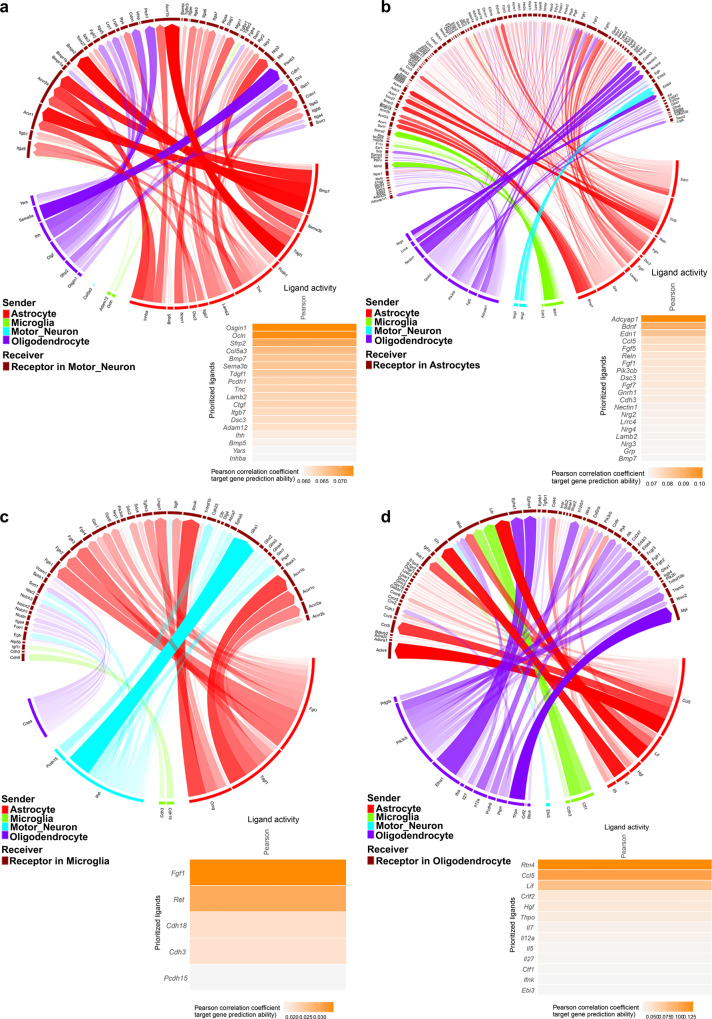
Fig. 2. Intercellular communication between motor neurons, astrocytes, microglia and oligodendrocytes is altered between SOD1G93A and WT cells at peri-symptomatic onset stage of disease.
Circos plots88 of the top putative ligand–receptor interactions and heatmaps of top ligands’ Pearson correlation coefficients, an estimate of ligand activity, in: a motor neurons, b astrocytes, c microglia, and d oligodendrocytes. Line width and opacity indicate ligand–receptor interaction weight. Color legend indicates predicted cellular source of ligand based on maximal expression in included cell types. N = 3 independent mice per genotype per sex.

