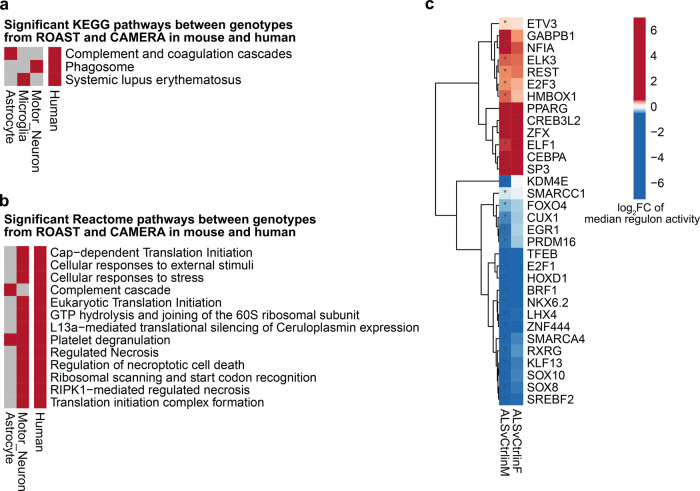
Fig. 8. Complement-associated pathways and cell death-associated pathways are identified in both murine cell type-specific analyses and in bulk ALS patient cervical spinal cord.
Heatmaps illustrating gene sets that are differentially expressed between genotypes in murine cell types and bulk human ALS patients vs. controls by both ROAST and CAMERA for (a) KEGG pathways and (b) Reactome pathways. Up-regulation and down-regulation are indicated in red and blue, respectively (FDR < 0.05). c Heatmap illustrating transcription factors, identified by SCENIC, whose regulon activities differ by diagnosis (FDR < 0.05). In a, b N = 3 independent mice per genotype per sex. In a–c, N = 76 ALS and N = 11 non-neurological control patients.

