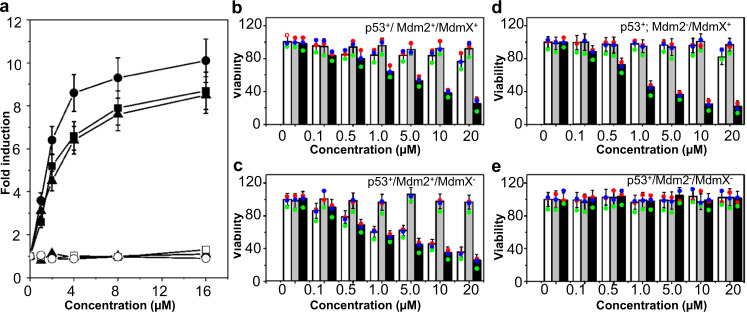
Fig. 9. Biological activity of H203.
a Treatment of cancer cells with H203 induced the expression of the p21 gene but not the p53 gene. Solid and open symbols indicate p21 and p53 transcription levels, respectively. Triangle: H460a cell; circle: RKO cell; and square: HCT116 cell. n = 3 independent experiments, and the data are represented as mean values ± SD. b–e The viability of the H1299 cells overexpressing Mdm2 and/or MdmX was significantly influenced by H203 compared with nutlin-3a and nutlin-3b. Empty bar: nutlin-3a (a positive control); gray bar: nutlin-3b (a negative control); and dark bar: H203. H1299p53+/Mdm2+/MdmX+ cells (b); H1299p53+/Mdm2+/MdmX- cells (c); H1299p53+/Mdm2-/MdmX+ cells (d); and H1299p53+/Mdm2-/MdmX− cells (e). n = 3 independent experiments and the data are represented as mean values ± SD. Source data for (a–e) are provided as a Source Data file.

