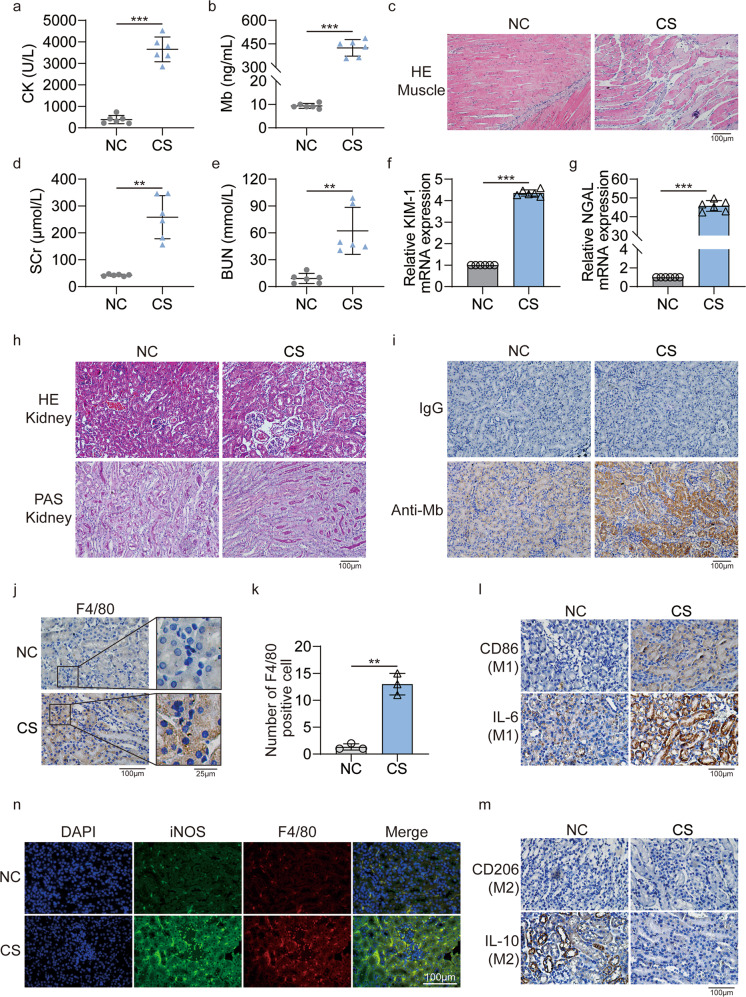
Fig. 1. Successful construct the CS-AKI mouse model.
a, b Concentration of biochemical indicators CK and myoglobin in serum. c HE staining analyses the pathological changes of muscle in the CS group (original magnification: 200×; scale bar: 100 μm). d, e Concentration of biochemical indicators SCr and BUN in serum. f, g qPCR analyses KIM-1 and NGAL mRNA level at the CS group. h HE and PAS staining analyze the pathological changes of renal tissues in the CS group (original magnification: 200×; scale bar: 100 μm). i IHC staining for myoglobin in the CS group, IgG as a negative control (original magnification: 200×; scale bar: 100 μm). j Representative anti-F4/80 staining showing increased macrophage infiltration in CS group compared to NC group (original magnification: 400×; scale bar: 100 μm). k F4/80-positive cells are counted equivalent infiltration of macrophages. l, m IHC staining analyses the expression of M1 associated molecular CD86, IL-6 and M2 associated molecular CD206, IL-10 in kidney tissues (original magnification: 400×, scale bar: 100 μm). n Representative confocal microscopy images of sections from kidneys harvested in NC and CS group mice stained for iNOS (green), F4/80 (red) and DAPI (blue) (scale bar: 100 μm). For statistical analysis, an unpaired two-tailed Student’s t test was used. Data are expressed as mean ± SD. n = 6. **P < 0.01, ***P < 0.001.

