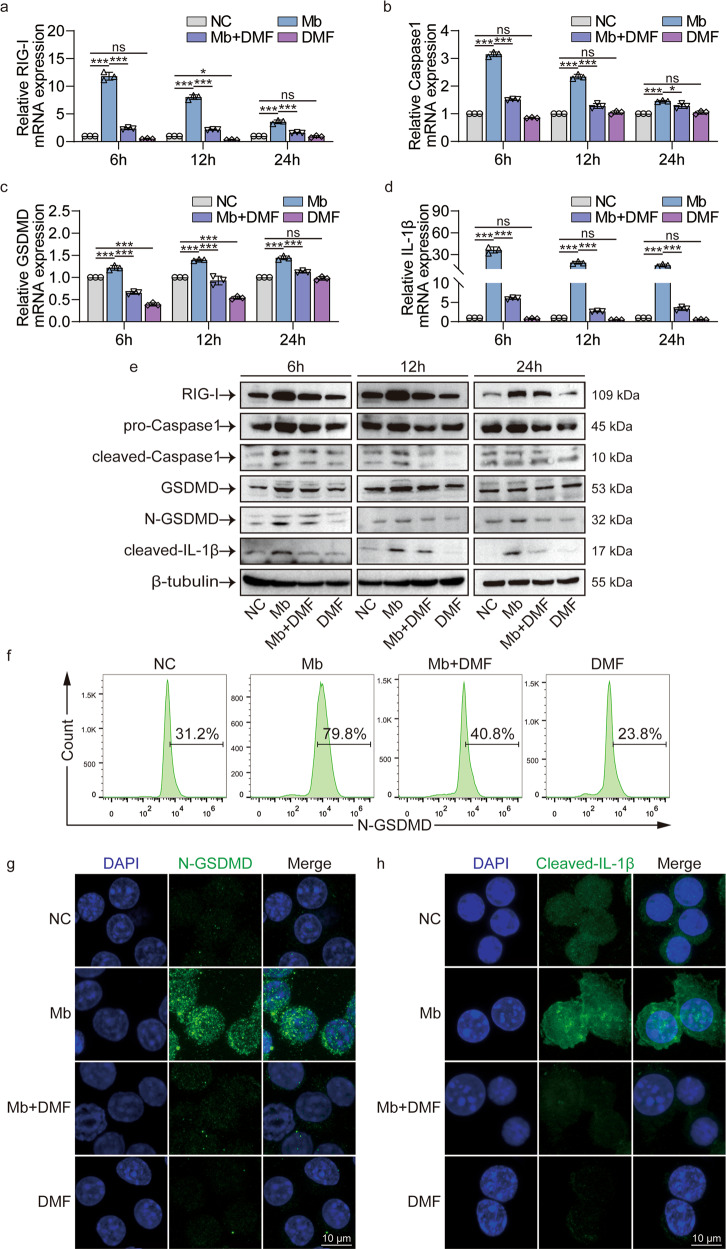
Fig. 5. DMF inhibits RIG-I/Caspase1/GSDMD pyroptosis pathway after ferrous myoglobin treatment.
a–d qPCR analyses RIG-I, caspase1, GSDMD, IL-1β expression in NC, Mb, Mb + DMF, and DMF group. e WB analyses RIG-I, caspase1, cleaved-caspase1, GSDMD, N-GSDMD, cleaved-IL-1β expression in NC, Mb, Mb+DMF, and DMF group. f Flow cytometry analyses N-GSDMD expression in NC, Mb, Mb+DMF, and DMF group. g, h Representative confocal microscopy images of cells in NC, Mb, Mb + DMF, and DMF group stain for N-GSDMD and cleaved-IL-1β (Scale bars: 10 μm). For statistical analysis, two-factor ANOVA followed by Tukey’s method of multiple comparisons used in (a–d). Data are expressed as mean ± SD, n = 3 per group. *P < 0.05, **P < 0.01, ***P < 0.001.

