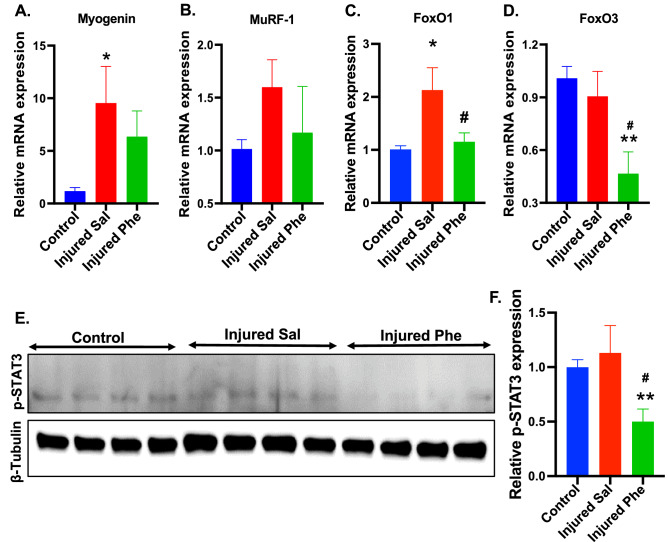
Figure 4.
Effects of phentolamine on the muscle atrophy genes in vivo. (A–D) Relative mRNA expression of the genes (A) Myogenin, (B) MuRF-1, (C) FoxO1, and (D) FoxO3 was quantified by qPCR in the soleus at 7 dpi, normalized to HPRT-1. Statistical significance was determined using one-way ANOVA followed by Benjamini and Hochberg correction was performed to calculate statistical significance (n = 5 animals per treatment group). (E) The representative cropped immunoblot images showing the expression of phosphorylated STAT3 at Ser727 (p-STAT3) and β-tubulin in the soleus muscles at 7 dpi. After transfer, membranes were cut using standard marker and stained separately with primary antibodies (p-STAT3 and β-tubulin) followed by secondary antibodies. Original immunoblot images are provided in the Supplementary Fig. S4. (F) Quantification histogram of western immunoblot comparing p-STAT3 expression levels among groups (n = 4–5 per treatment group). One-way ANOVA followed by Benjamini and Hochberg correction was performed to calculate statistical significance. Data show the average of two-independent experiments. Data are presented as Mean ± SEM (*p ≤ 0.05, **p ≤ 0.01, ***p ≤ 0.001). #p ≤ 0.05, ##p ≤ 0.01, ###p ≤ 0.001 represent significance between injured Sal and Injured Phe treatment groups.

