Figure 1.
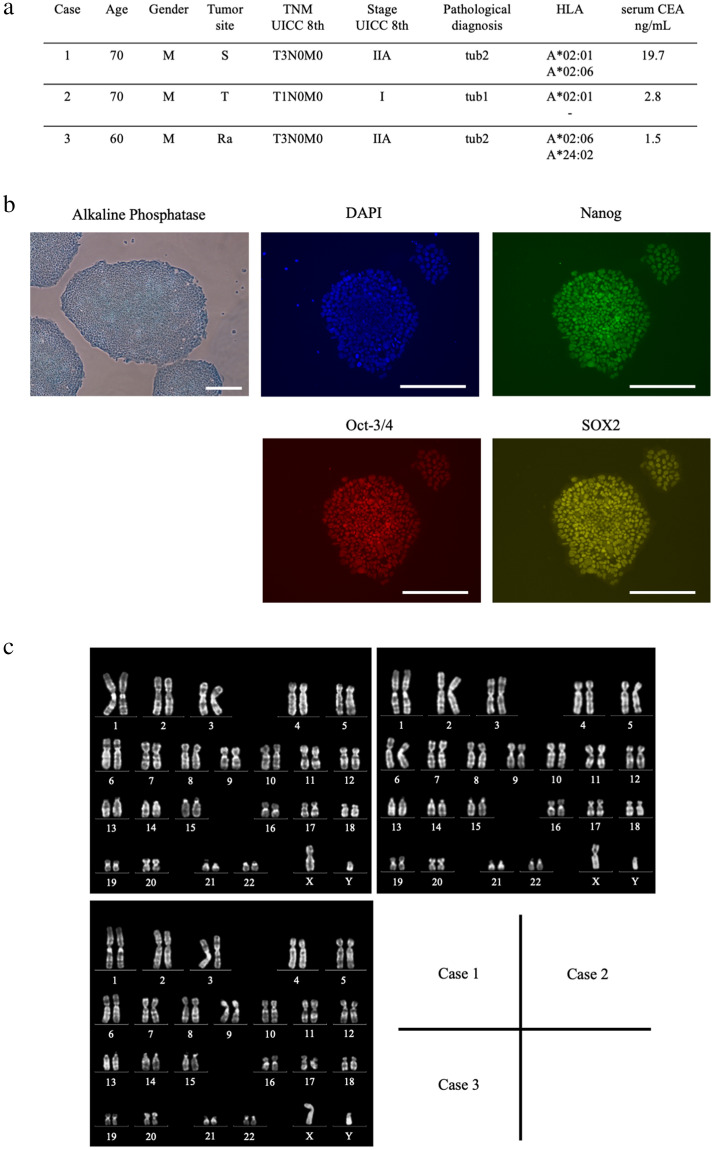
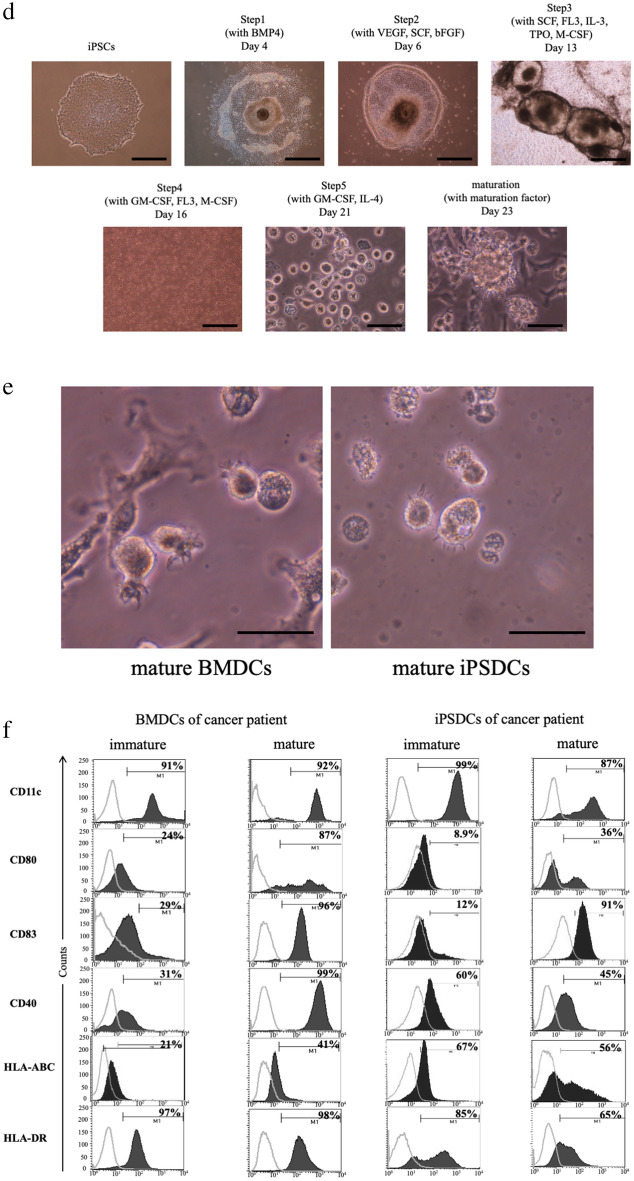
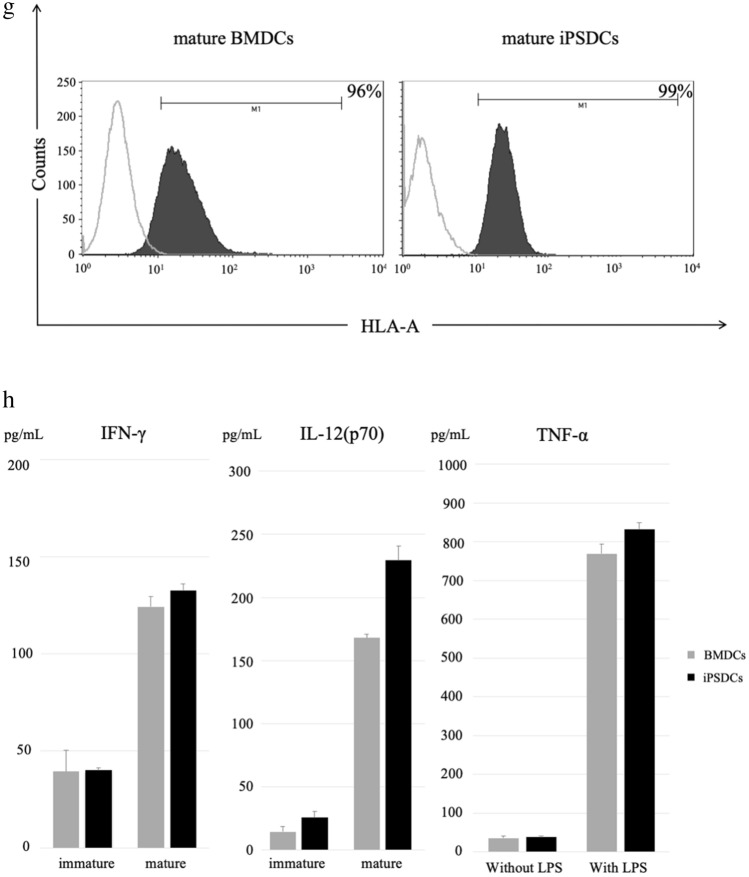
Generation of iPSDCs from patient-derived autologous iPSCs and their cell characterization in comparison to BMDCs. (a) List of colorectal cancer samples. The HLA-A allele was determined using an HLA-A High Resolution Typing System. Neoantigen analysis was performed in Case 3. Abbreviation Description S is sigmoid colon, T is transverse colon, Ra is upper rectum, tub1 is well-differentiated adenocarcinoma, and tub2 is moderately-differentiated adenocarcinoma. (b) Characterization of autologous iPSCs derived from a patient, Case 1. Alkaline phosphatase staining and fluorescent staining with undifferentiated markers showed pluripotency of iPSCs. Scale bars = 80 μm. (c) Karyotyping of iPSCs. No chromosomal abnormalities were found in these chromosomes in Case 1, 2, and 3. (d) The schematic diagram of differentiation protocol for iPSDCs. Scale bars = 80 μm (Before Day 16). Scale bars = 20 μm (After Day 21). (e) Morphology showing mature BMDCs (left) and mature iPSDCs (right) derived by Case 1. Scale bars = 20 μm. (f) Surface phenotypes of BMDCs (left) and iPSDCs (right) derived from the same cancer patient, Case 3. Black-filled histograms represent the staining results of specific antibodies. Gray lines highlight isotype-matched controls. (g) The expression of HLA-A on mature iPSDCs and BMDCs. Black-filled highlight the staining results of HLA-A. Gray lines histograms represent the isotype-matched controls. (h) The secretion of IFN-γ, IL-12(p70) and TNF-α from BMDCs and iPSDCs was examined by ELISA assay. Data represent the mean ± SD (three donors for each group).


