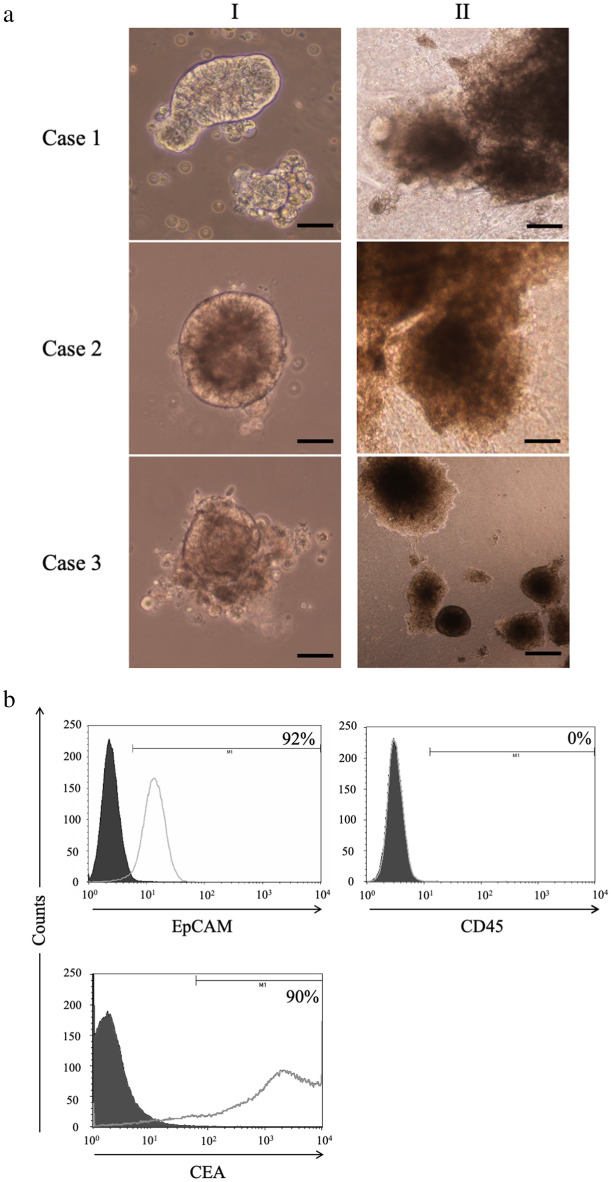
Figure 2.
Establishment of Autologous CTOSs. (a) Formation of CTOSs from colorectal cancer tissues of three patients. Phase contrast images of organoid fraction: I, suspension culture; II, 3D culture. Scale bar = I, 100 μm; II, 40 μm. (b) Expression of EpCAM, CD45, and CEA in the CTOSs established from Case 1. Black-filled histograms represent the isotype-matched control. Gray lines highlight the staining results of EpCAM, CD45, and CEA.

