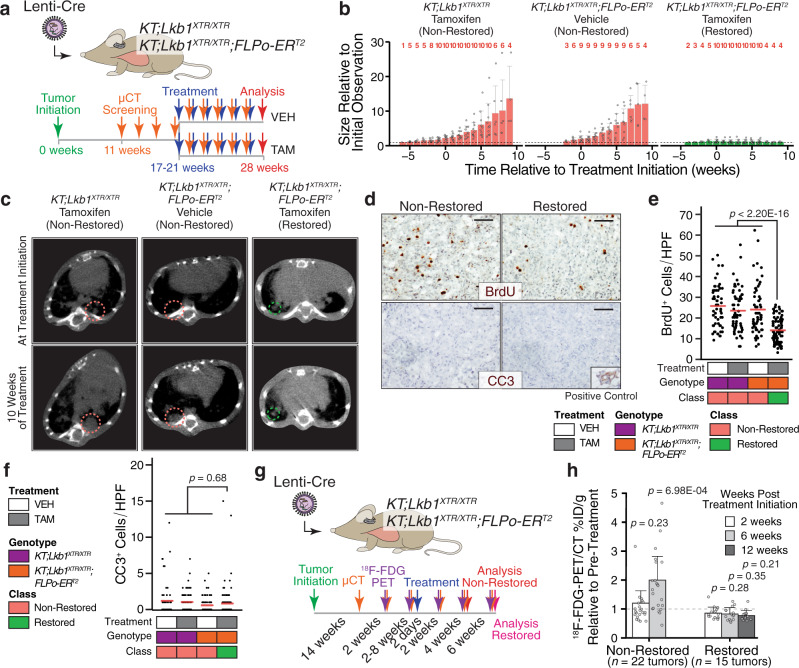
Fig. 2. Lkb1 restoration drives tumor stasis and suppresses the increase in glucose avidity that accompanies progression.
a Longitudinal µCT imaging of lung tumors in KT;Lkb1XTR/XTR and KT;Lkb1XTR/XTR;FLPo-ERT2 mice. Treatment began within 1 to 6 weeks from initial detection of lung tumors. Tumors were tracked for an additional 6–10 weeks, and lung tissue was harvested at 28 weeks. VEH vehicle, TAM tamoxifen. b Changes in tumor volume. Red numbers indicate the number of tumors measured at a given time point. Bars correspond to the mean tumor volume relative to size at first detection. Error bars indicate standard deviation. Source data is displayed in Supplementary Fig. 6b. KT;Lkb1XTR/XTR-tamoxifen, n = 10 tumors; KT;Lkb1XTR/XTR;FLPo-ERT2-vehicle, n = 9 tumors; KT;Lkb1XTR/XTR;FLPo-ERT2-tamoxifen, n = 10 tumors. c Representative µCT images of tumor-bearing lungs at treatment initiation (top) and after 10 weeks of treatment (bottom). d BrdU (top) and cleaved caspase 3 (CC3; bottom) detection by IHC within Lkb1 non-restored (left) and restored (right) lung tumors following 2 weeks of treatment with vehicle or tamoxifen. Inset image shows CC3 staining of involuting mammary gland. Scale bars = 100 µm. Images were acquired from a single experiment including multiple biological replicates as noted in e, f. e, f Quantification of BrdU+ (e) and CC3+ (f) cells within Lkb1-restored and non-restored tumors. Each dot represents a ×20 field. Red crossbars indicate the mean. In e, KT;Lkb1XTR/XTR-vehicle, n = 60 fields; KT;Lkb1XTR/XTR-tamoxifen, n = 60 fields; KT;Lkb1XTR/XTR;FLPo-ERT2-vehicle, n = 60 fields; KT;Lkb1XTR/XTR;FLPo-ERT2-tamoxifen, n = 80 fields. In f, KT;Lkb1XTR/XTR-vehicle, n = 60 fields; KT;Lkb1XTR/XTR-tamoxifen, n = 80 fields; KT;Lkb1XTR/XTR;FLPo-ERT2-vehicle, n = 80 fields; KT;Lkb1XTR/XTR;FLPo-ERT2-tamoxifen, n = 120 fields. One tissue section per mouse was analyzed. P values calculated by two-sided unpaired t test. HPF high-power field, VEH vehicle, TAM tamoxifen. g Serial 18F-FDG-PET/CT imaging. Tamoxifen treatment of KT;Lkb1XTR/XTR, and KT;Lkb1XTR/XTR;FLPo-ERT2 mice began within 2 days of establishing baseline levels of 18F-FDG uptake (at least two measurements within 18–24 weeks after tumor initiation). 18F-FDG uptake was captured after 2 and 6 weeks of treatment, as well as at 12 weeks for restored mice. h Changes in 18F-FDG uptake in restored (n = 15 tumors) and non-restored (n = 22 tumors) tumors. Source data displayed in Supplementary Fig. 8c. P values calculated by two-sided unpaired t test.

