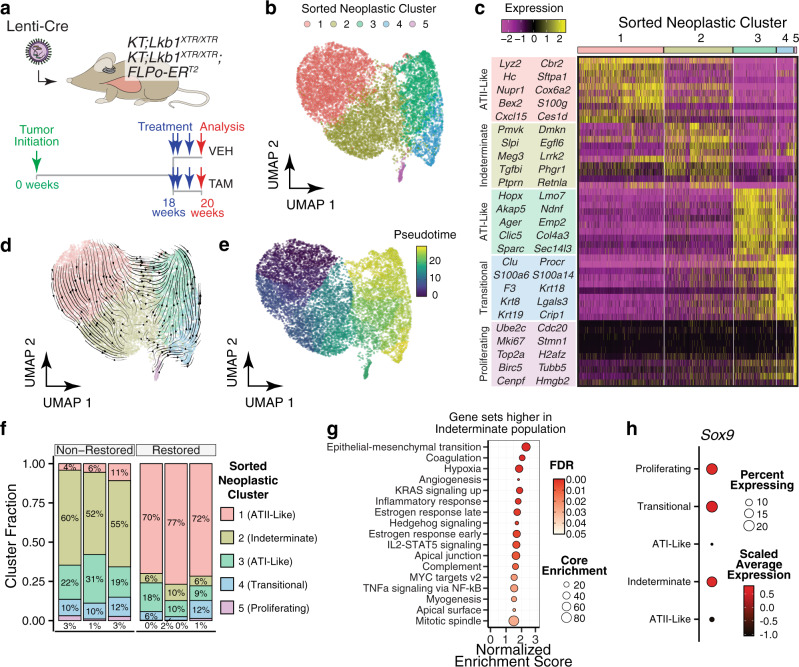
Fig. 4. Lkb1 restoration enforces an alveolar type II-like cell state.
a Profiling the acute transcriptional response to Lkb1 restoration within established tumors at single-cell resolution. KT;Lkb1XTR/XTR-vehicle, n = 1 mouse; KT;Lkb1XTR/XTR-tamoxifen, n = 1 mouse; KT;Lkb1XTR/XTR;FLPo-ERT2-vehicle, n = 1 mouse; KT;Lkb1XTR/XTR;FLPo-ERT2-tamoxifen, n = 3 mice. b Single-cell RNA-seq on tdTomatopositive neoplastic cells from Lkb1-restored and non-restored tumors. Cell fill reflects assignment to clusters defined by the Louvain algorithm. c Top ten markers that define each of the neoplastic cell clusters. The predicted cell type identities are listed to the left. Louvain cluster assignments are indicated by the bars at the top of the heatmap. d RNA velocity analysis on neoplastic cells. Velocity vectors are summarized as streamlines overlaid on UMAP embeddings. The general direction of flow follows that of the ATII-ATI differentiation axis, with the indeterminate cluster residing at an intermediate position. e Trajectory inference analysis on sorted neoplastic cells. Cell fill corresponds to its relative position in pseudotime. The pseudotime trajectory runs along the ATII-ATI differentiation axis, with the indeterminate cluster residing at an intermediate position. f Proportion of each neoplastic epithelial subpopulation within Lkb1-restored and non-restored tumors. Fill reflects Louvain cluster assignments, and their corresponding predicted identities are listed. Each column corresponds to an individual animal. g GSEA comparing cells of the ATII-like and indeterminate clusters at the pseudobulk level using the Hallmarks module. The size of dots corresponds to the number of core enrichment genes and the fill color reflects FDR. The plotted gene sets correspond to those that were enriched among the genes that are higher in the indeterminate cluster relative to the ATII-like cluster. h Expression of Sox9 across the five Louvain clusters. Predicted cluster identities are listed (left). Fill indicates average expression and dot size reflects the proportion of cells within a given cluster that express Sox9.

