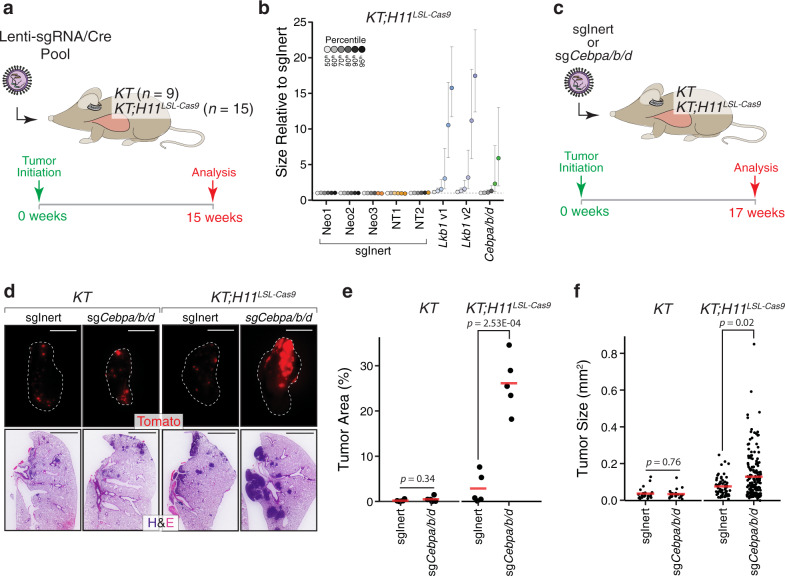
Fig. 5. C/EBP transcription factors constrain oncogenic KRAS-driven lung tumor growth.
a Interrogation of the tumor-suppressive capacity of a series of LKB1-dependent genes and C/EBP transcription factors (targets listed in Supplementary Fig. 16b). Lenti-sgRNA/Cre vectors targeting each candidate gene were pooled prior to delivery into KT and KT;H11LSL-Cas9 mice (method outlined in Supplementary Fig. 16b). b Bulk tumor-bearing lungs were analyzed by Tuba-seq. Percentile plot depicting tumor size at several percentiles relative to the distribution of tumors initiated with Lenti-sgRNA/Cre vectors encoding inert sgRNAs (sgNeo1, sgNeo2, sgNeo3, sgNT1, sgNT2). Lkb1 and C/ebp family targeting vectors are shown. Each vector has a distinct fill color, and fill saturation indicates percentile. Colored fill indicates that tumor size at a given percentile is significantly different from inert sgRNAs, while grayscale indicates no significant difference. Error bars indicate 95% confidence intervals centered on the mean of relative tumor size at a given percentile. c Validation of C/EBP factors as suppressors of oncogenic KRAS-driven tumor growth in a non-multiplexed format. Tumors were initiated in KT and KT;H11LSL-Cas9 mice with either Lenti-sgInert/Cre (sgNeo1/sgNT1/sgNeo2; sgInert) or Lenti-sgCebpa/b/d/Cre (sgCebpa/sgCebpb/sgCebpd; sgCebpa/b/d). N = 5 mice per genotype-virus cohort. d Representative fluorescence (top) and H&E (bottom) images of tumor-bearing lungs from KT and KT;H11LSL-Cas9 mice transduced with either Lenti-sgInert/Cre or Lenti-sgCebpa/b/d/Cre. Lung lobes within fluorescent images are outlined in white. N = 5 mice per genotype-virus cohort. Top scale bars = 5 mm. Bottom scale bars = 2 mm. e, f Quantification of tumor area (e) and tumor size (f) by histological examination of tumor-bearing lungs from KT and KT;H11LSL-Cas9 mice transduced with either Lenti-sgInert/Cre or Lenti-sgCebpa/b/d/Cre. Each dot represents either individual mice (e) or individual tumors (f). Red crossbars indicate the mean. In e, n = 5 mice per genotype-virus cohort. One tissue section per mouse was analyzed. In f, KT-sgInert, n = 22 tumors; KT-sgCebpa/b/d, n = 23 tumors; KT;H11LSL-Cas9-sgInert, n = 58 tumors; KT;H11LSL-Cas9-sgCebpa/b/d, n = 167 tumors. P values were calculated by a two-sided unpaired t test.

