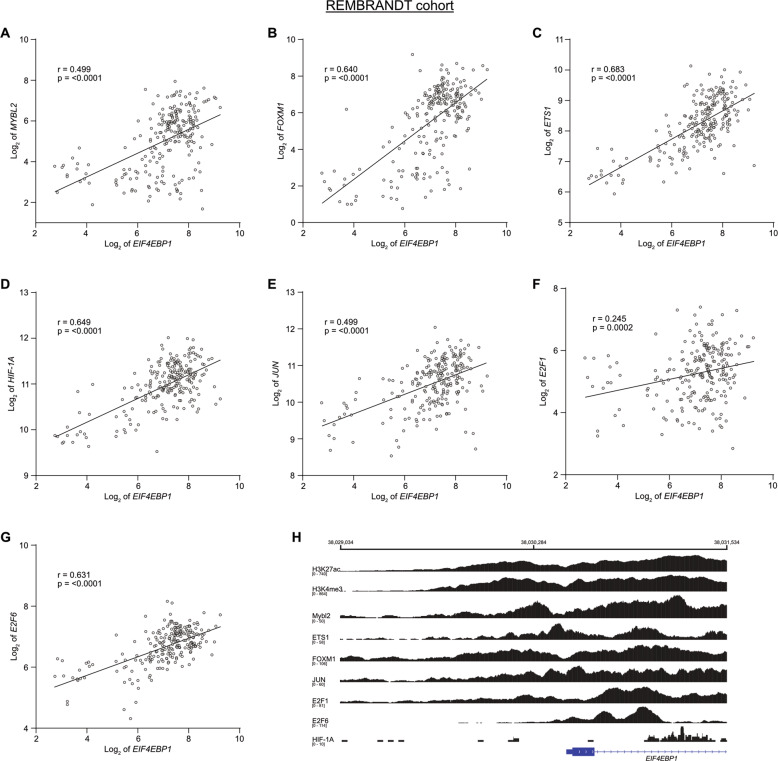
Fig. 2. Co-expression of EIF4EBP1 and EIF4EBP1 promoter binding transcription factor genes in glioblastoma tissue samples.
A–G Expression levels of EIF4EBP1 mRNA in glioblastoma patient samples plotted against the mRNA expression levels of (A) MYBL2, (B) FOXM1, (C) ETS1, (D) HIF-1A, (E) JUN, (F) E2F1 or (G) E2F6 in the REMBRANDT cohort (n = 228 patients) [26]. Co-expression levels were quantified by calculating the Pearson correlation coefficient. H ChIP peak locations within the human EIF4EBP1 promoter, exon 1 and part of intron 1 (−1500 to +1000; hg38; Chr8: 38,029,034–38,031,534) from ChIP-sequencing data for histone H3K27 acetylation (H3K27ac) and H3K4 trimethylation (H3K4me3), ETS1, FOXM1, JUN, E2F1, and E2F6 (Encode consortium, Encyclopedia of DNA Elements at UCSC; [41, 42]), HIF-1A (accession code GSE39089; name GSM955978; run SRR518265 [43]) and MYBL2 (accession code GSE119972; name GSM3389599 [44]).

