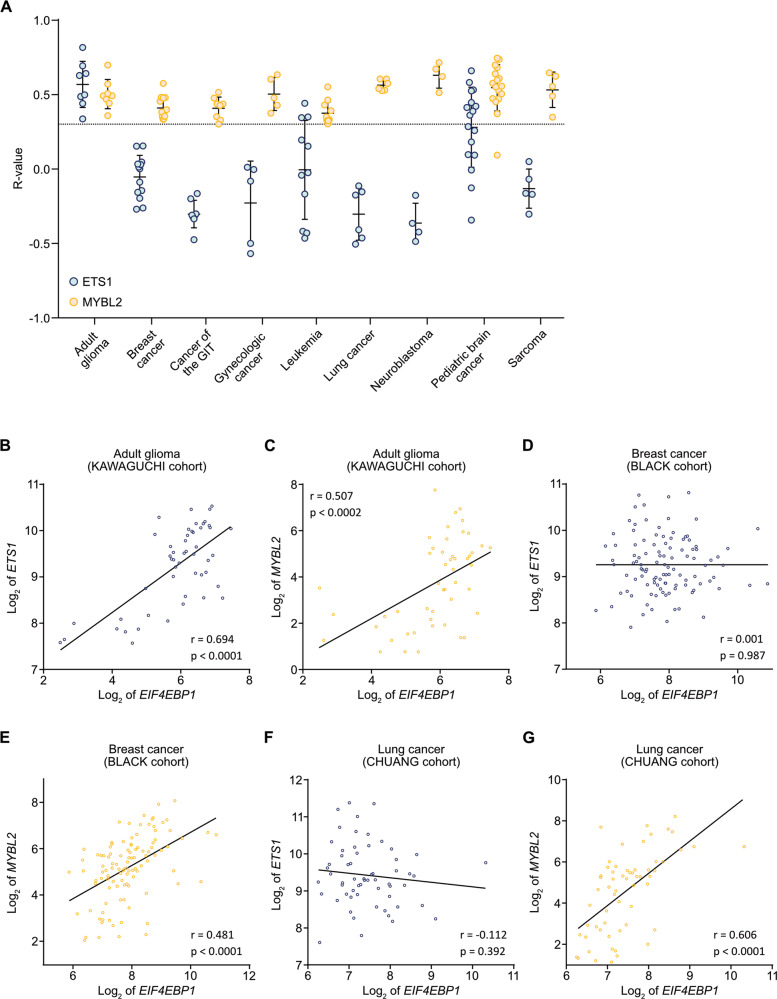
Fig. 5. Co-expression of EIF4EBP1 and MYBL2 or ETS1 in different cancer entities.
A Correlation between the mRNA expression levels of EIF4EBP1 and ETS1 (light blue dots) or MYBL2 (yellow dots) in the indicated human cancer types (Table S3). Co-expression levels were quantified by calculating the Pearson correlation coefficient. Each dot represents the R-value for one cohort. The dotted line corresponds to an R-value of 0.3, chosen as the cut-off for positive correlation. B–H Representative co-expression analysis between EIF4EBP1 mRNA and B, D, F ETS1 (light blue dots) or C, E, G MYBL2 (yellow dots) mRNA levels in the indicated tumor type and cohort. The represented cohorts are (B, C) glioma (KAWAGUCHI cohort; n = 50) [36], D, E breast cancer (BLACK cohort; n = 107) [45], and F, G lung cancer (CHUANG cohort; n = 60) cohort [46]. Co-expression levels were quantified by calculating the Pearson correlation coefficient. GIT, gastrointestinal tract.

