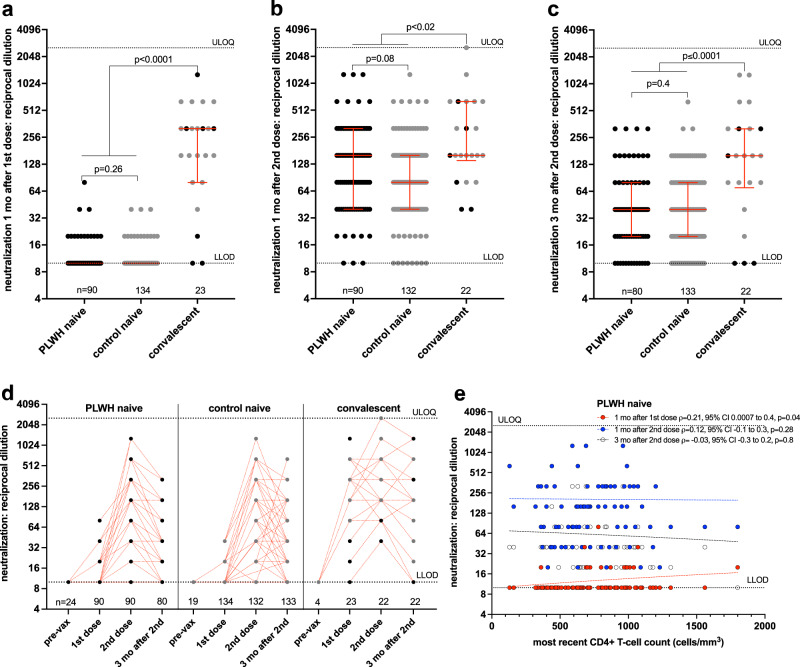
Fig. 3. Ability of vaccine-induced antibodies to neutralize live SARS-CoV-2 following one and two COVID-19 vaccine doses.
a Viral neutralization activities, defined as the highest reciprocal plasma dilution at which neutralization was observed in all triplicate assay wells, one month following the first COVID-19 vaccine dose in PLWH (black circles) and controls (grey circles) who were COVID-19 naive at study entry. Convalescent participants are colored by subgroup. The numbers of participants analyzed are indicated at the bottom of the plot. Red bars and whiskers represent median and IQR. p-values were computed using the Mann–Whitney U-test and are uncorrected for multiple comparisons. U-statistics were 5721 (PLWH naive vs. control naive), 116 (PLWH naive vs. convalescent) and 158 (control naive vs. convalescent). LLOD: assay lower limit of detection. ULOQ: assay upper limit of quantification. b Viral neutralization activities one month after the second vaccine dose, presented as in (a). U-statistics were 5131 (PLWH naive vs. control naive), 664 (PLWH naive vs. convalescent) and 777 (control naive vs. convalescent). c Viral neutralization activities 3 months after the second dose, presented as in (a). U-statistics were 4984 (PLWH naive vs. control naive), 431 (PLWH naive vs. convalescent) and 686 (control naive vs. convalescent). d Viral neutralization activities plotted longitudinally for each group. Pre-vaccine measurements were performed only on a subset of COVID-19 naive and convalescent participants, none of whom had detectable neutralization activity at this time. The numbers of participants analyzed are indicated at the bottom of the plot. Note that many values are superimposed. Red dotted lines connect participants’ longitudinal measurements. e Correlation between most recent CD4+ T-cell count and viral neutralization activities one month after the first dose (red circles, n = 90), one month after the second dose (blue circles, n = 90) and three months following the second dose (clear circles, n = 80). Matching-coloured dotted lines help visualize the trend.

