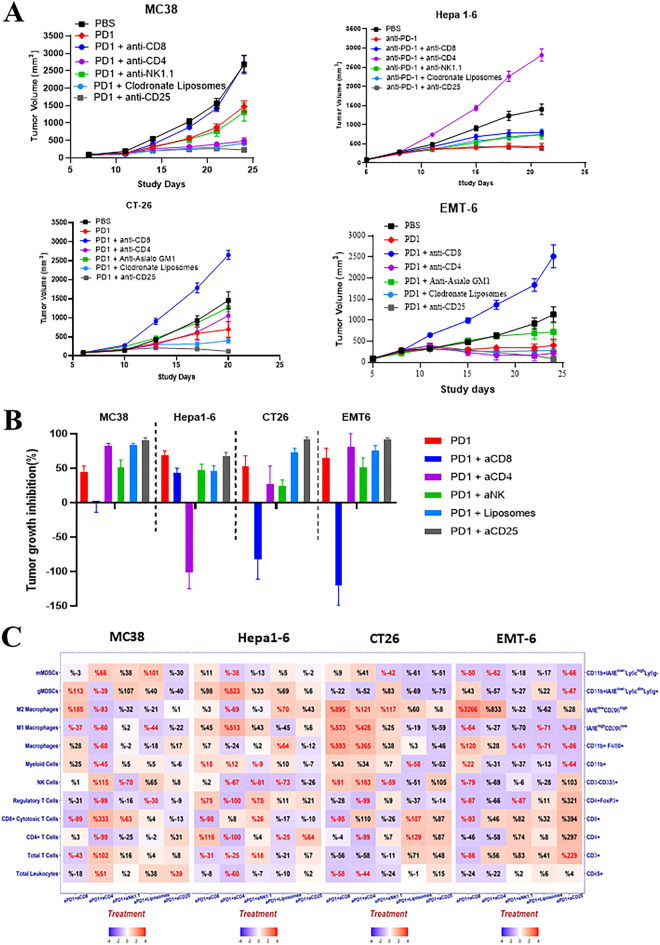
Figure 3.
Impact on anti-PD-1 antibody response across syngeneic models (A) Growth curves of MC38, Hepa-1–6, CT26 and EMT-6 subcutaneous tumors following depletion of specific immune lineages with anti-PD-1 treatment (10 mg/kg) and (B) TGI summarized in a bar plot (% relative to non-treated control). (C) Heat map showing dynamic TIL changes in all 4 subcutaneous tumors following depletion of specific immune lineages (% TIL relative to anti-PD-1 control) represented as either positive or negative values (red or blue shading respectively) with the intensity of color positively-correlating with the absolute value of % change (plotted using R v3.5.2). Text highlighted in red shows significant (p value < 0.05) % changes.

