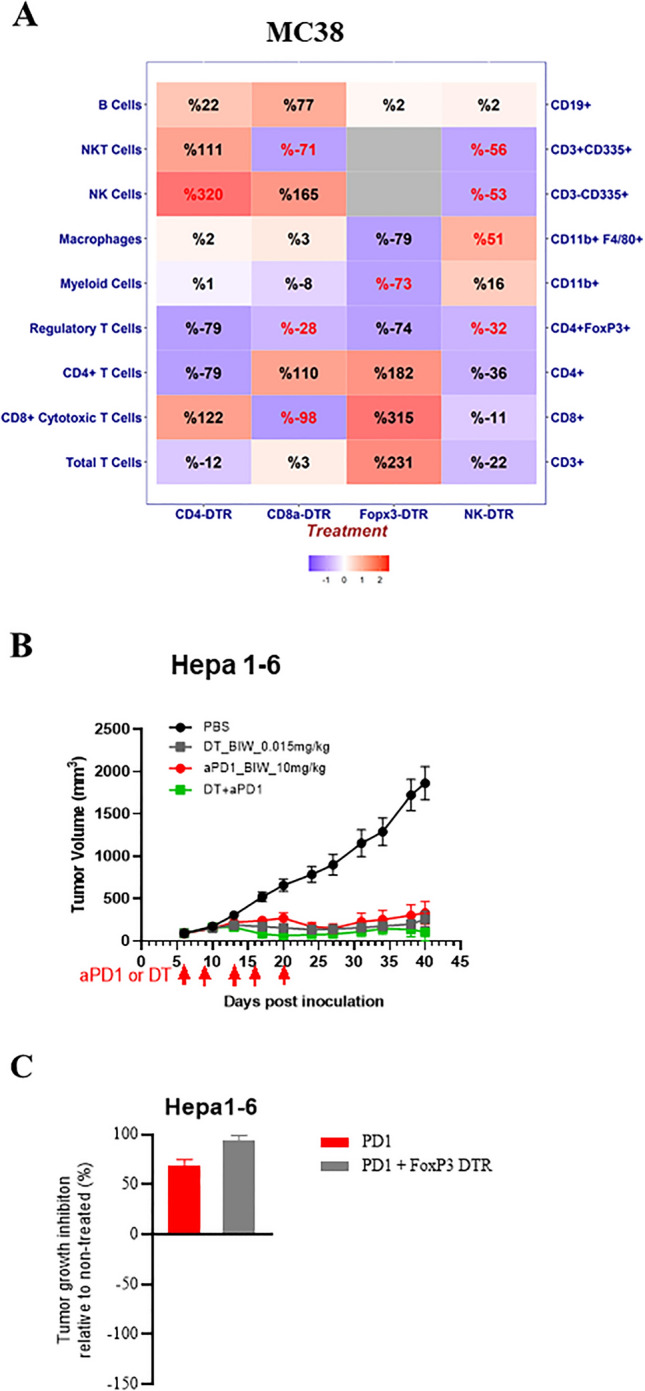
Figure 6.

Impact of targeted immune cell depletion in DTR transgenic mice; (A) Heat map of TIL pharmacodynamic assessed by FACS (% TIL relative to untreated control) in DTR mice bearing MC38 tumors following specific immune cell depletion, represented as either positive or negative values (red or blue shading respectively) with the intensity of color positively correlating with the absolute value of % change (plotted using R v3.5.2). Text highlighted in red shows significant (p value < 0.05) % changes. (B) Growth curve of Hepa-1–6 subcutaneous tumors following treatment of Foxp3-DTR mice with DT with and without anti-PD-1 treatment (10 mg/kg) with (C) TGI summarized in a bar plot (% relative to non-treated control).
