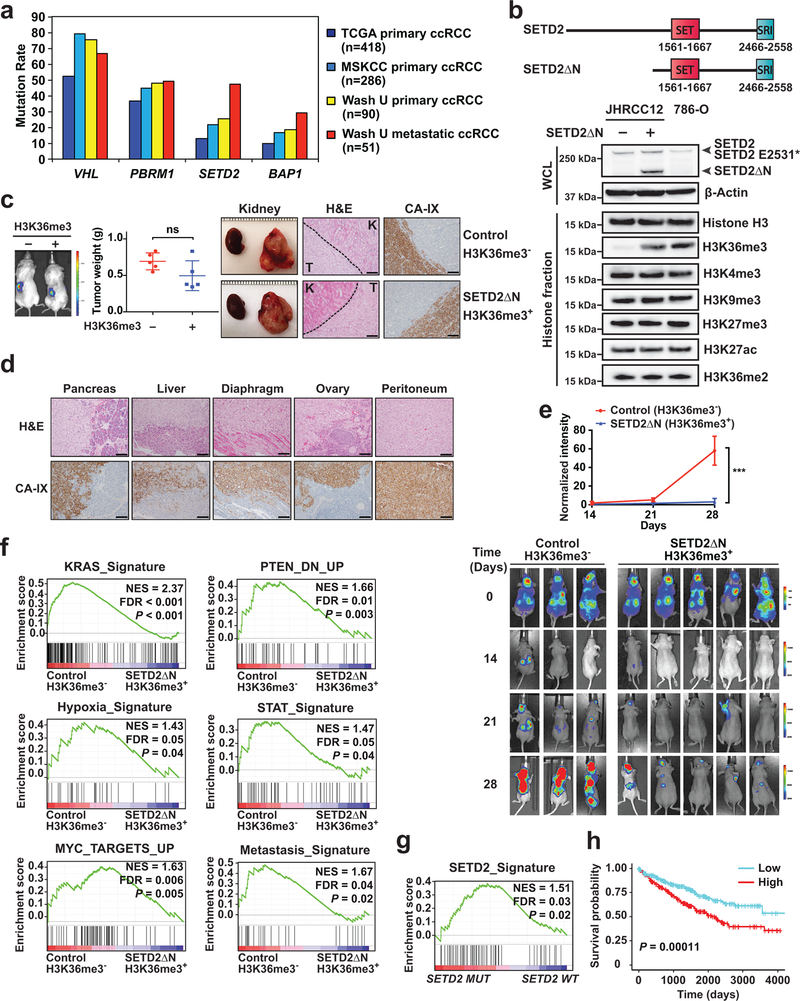
Fig. 1 |. SETD2 is highly mutated in metastatic ccRCC tumors and restoration of H3K36me3 in SETD2 mutant ccRCC suppresses tumor metastasis.
a, The mutation rates of VHL, PBRM1, SETD2, and BAP1 in the indicated ccRCC cohorts. b, A schematic diagram of the domain structure of SETD2 and SETD2ΔN. Whole cell lysates (WCL) and histone fractions from the indicated JHRCC12 cells or from 786-O cells were assessed by immunoblots. c, The indicated luciferase-transduced JHRCC12 cells were injected into subrenal capsules of unilateral kidneys of NSG mice to establish orthotopic xenografts. Successful injection was confirmed by bioluminescence imaging. A representative bioluminescence image is shown. The weight of kidney tumors in each mouse was estimated by subtracting the weight of kidney without orthotopic implantation from that of kidney with orthotopic implantation after 5–6 weeks. Data shown are mean ± s.d. (n = 5 mice for each group, two-tailed unpaired Student’s t-test). Representative gross images of bilateral kidneys (only left kidney with orthotopic xenograft tumors), H&E staining and immunohistochemistry staining for CA-IX are shown. T, tumor; K, adjacent normal kidney. Scale bars, 100 μm. d,, Representative H&E staining and IHC staining for CA-IX of the indicated organs with metastatic tumors developed in mice received orthotopic implantation of JHRCC12 cells. Scale bars, 100 μm. e, Bioluminescence images of athymic nude mice at the indicated times after intracardiac injection of the indicated luciferase-transduced JHRCC12 cells (mean ± s.d., n = 3 mice for H3K36me3-deficient and n = 5 mice for H3K36me3-proficient). ***, P = 0.0002 (two-way ANOVA). f, GSEA plots of the differentially expressed genes (FDR < 0.05) comparing control (H3K36me3−) with SETD2ΔN-transduced (H3K36me3+) JHRCC12 cells using the indicated gene sets. NES, normalized enrichment score. g, GSEA plot of the differentially expressed genes (FDR < 0.05) comparing SETD2MT with SETD2WT human ccRCC from TCGA using the SETD2-dependent gene signature defined in JHRCC12 cells. h, Kaplan-Meier analysis of overall survival in ccRCC patients from TCGA based on the expression of the refined SETD2 signature (the top 50% highly expressed are shown in red and the bottom 50% are shown in blue). P = 0.00038 (Mantel–Cox test).

