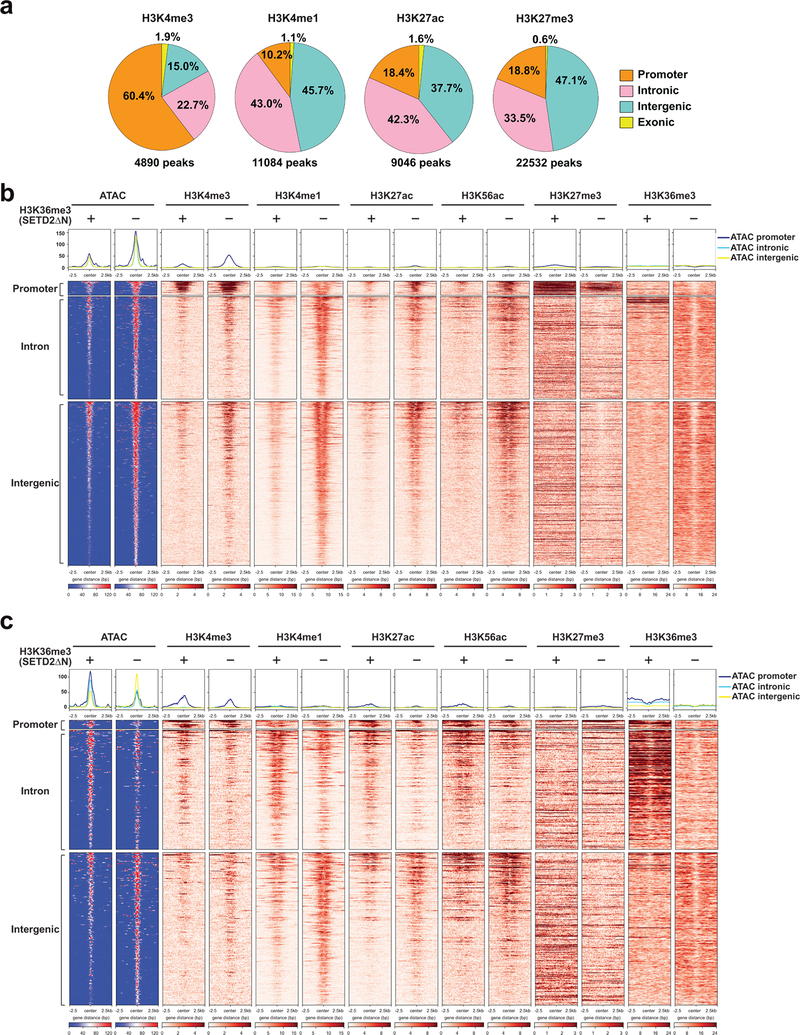
Extended Data Fig. 4. Loss of SETD2-mediated H3K36me3 induces genome-wide epigenetic changes.
a. Pie chart showing the percentage of differentially enriched ChIP-seq peaks (FDR < 0.05) for each histone mark in promoter, intronic, intergenic, and exonic regions comparing H3K36me3− with H3K36me3+ (SETD2ΔN-transduced) JHRCC12 cells. b. Heatmap of differentially accessible ATAC-seq peaks (FDR < 0.05 and log2(FC) > 1) assigned to an upregulated gene, in a 5kb window grouped by localization at promoter, intron, and intergenic regions (n = 1012). c. Heatmap of differentially accessible ATAC-seq peaks (FDR < 0.05 and log2(FC) > 1) assigned to a downregulated gene, in a 5kb window grouped by localization at promoter, intron, and intergenic regions (n = 456).

