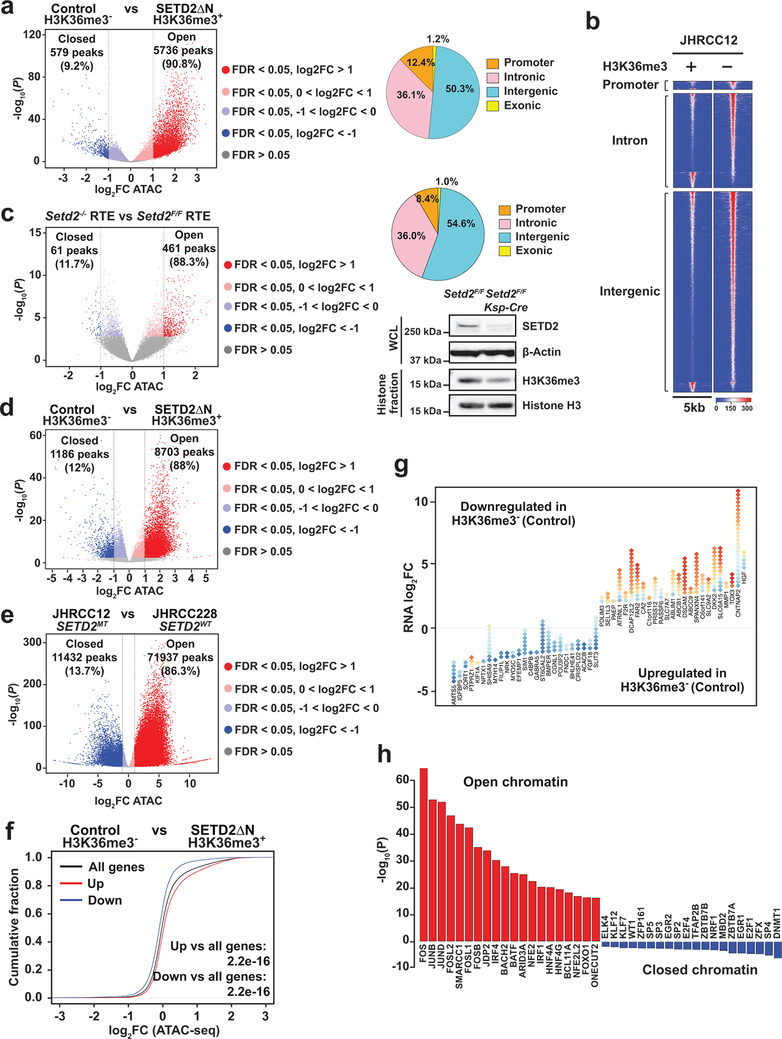
Fig. 2 |. Loss of SETD2-mediated H3K36me3 induces a genome-wide increase in chromatin accessibility that correlates with increased oncogenic transcriptional output.
a, Volcano plot of ATAC-seq peaks comparing control (H3K36me3−) with SETD2ΔN-transduced (H3K36me3+) JHRCC12 cells. Peaks with differential chromatin accessibility upon H3K36me3 restoration (FDR < 0.05; n = 24016) are highlighted. The number of peaks with significant changes (FDR < 0.05 and log2(fold change; FC) > 1; n = 6315 peaks) upon H3K36me3 restoration is shown. Pie chart showing the percentage of differentially accessible ATAC-seq peaks (FDR < 0.05) at promoter, intronic, intergenic, and exonic regions. b, Heatmap of differentially accessible ATAC-seq peaks described in a (FDR < 0.05 and log2(FC) > 1) in 5kb window grouped by localization at promoter, intron, and intergenic regions. c, Volcano plot of ATAC-seq peaks comparing primary murine renal tubular epithelial (RTE) cells cultured from Setd2F/FKsp-Cre+ mice with those from littermate Setd2F/F mice. Peaks with differential chromatin accessibility upon Setd2 deletion (FDR < 0.05) are highlighted. The number of peaks with significant changes (FDR < 0.05 and log2(FC) > 1) is shown. Whole cell lysates (WCL) and histone fractions from the indicated RTE cells were assessed by immunoblots. d-e, Volcano plots of ATAC-seq peaks comparing H3K36me3− with H3K36me3+ (SETD2ΔN-transduced) JHRCC12 PDXs (d) or comparing JHRCC12 (VHLMTPBRM1MTSETD2MT) PDXs with JHRCC228 (VHLMTPBRM1MTSETD2WT) PDXs (e). Peaks with differential chromatin accessibility (FDR < 0.05) are highlighted (red, open chromatin; blue, closed chromatin). The number of peaks with significant changes (FDR < 0.05 and log2(FC) > 1) is shown. P values were obtained using DESeq2 (Methods). f, Distribution of chromatin accessibility changes associated with significantly upregulated (red) or downregulated (blue) genes comparing H3K36me3− with H3K36me3+ JHRCC12 cells. P values calculated using one-sided KS test comparing peaks associated with differentially expressed genes to all genes. g, Diamond plots of changes in chromatin accessibility for the top 25 most upregulated and 25 most downregulated genes comparing H3K36me3− with H3K36me3+ JHRCC12 cells. Red, open chromatin; blue, closed chromatin. h, The 20 most significantly enriched transcription factor binding motifs in open (red) and closed (blue) chromatin peaks comparing H3K36me3− with H3K36me3+ JHRCC12 cells.

