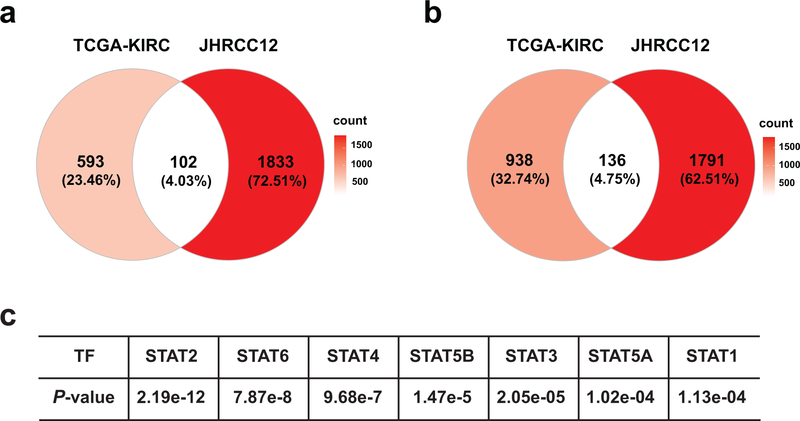
Extended Data Fig. 2. Summary of differentially expressed genes in H3K36me3− compared to H3K36me3+ JHRCC12 cells as well as in SETD2MT compared to SETD2WT ccRCC.
a, Venn diagram showing overlap of differentially upregulated genes (FDR < 0.05, log2(FC) > 0) in H3K36me3− compared to H3K36me3+ (SETD2ΔN-transduced) JHRCC12 cells and differentially upregulated genes (FDR < 0.05, log2(FC) > 0) in SETD2MT compared to SETD2WT ccRCC from the TCGA-KIRC dataset. b, Venn diagram showing overlap of differentially downregulated genes (FDR < 0.05, log2(FC) < 0) in H3K36me3− compared to H3K36me3+ (SETD2ΔN-transduced) JHRCC12 cells and differentially downregulated genes (FDR < 0.05, log2(FC) < 0) in SETD2MT compared to SETD2WT ccRCC from the TCGA-KIRC dataset. c, The open chromatin peaks comparing H3K36me3-with H3K36me3+ JHRCC12 cells were enriched for the binding motifs of STAT family transcription factors.

