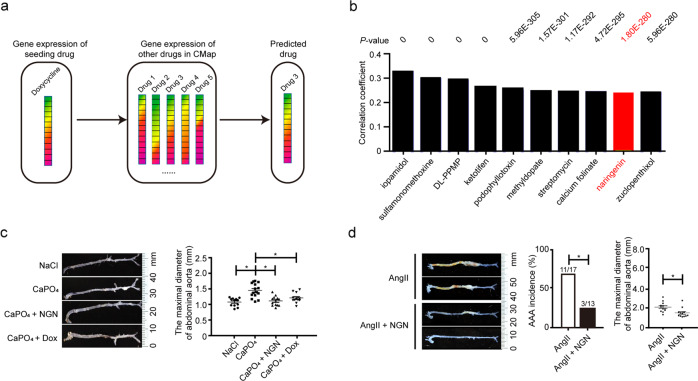
Fig. 1. Naringenin inhibited and Ang II-induced AAA formation.
a Schematic illustration of the transcriptome in response to doxycycline compared to the CMap database. The top ten drugs showing a significant correlation with doxycycline are listed in b. The y-axis represents the correlation coefficient (R) calculated by Spearman’s correlation analysis. The P value is shown on the top. c Representative photographs of macroscopic features of the CaPO4-induced aneurysms and quantification of the infrarenal aortic maximal diameter in C57BL/6J mice. NaCl, NaCl + PBS-treated plus water gavage (n = 12); CaPO4, CaCl2 + PBS-treated plus water gavage for 7 days (n = 15); CaPO4 + NGN, CaCl2 + PBS-treated plus naringenin gavage (50 mg/kg/day) (n = 13); CaPO4 + Dox, CaCl2 + PBS-treated plus doxycycline gavage (100 mg/kg/day) (n = 13). The right panel shows the quantification of the maximal diameter of the infrarenal aorta by ex vivo measurement. The data were analyzed using one-way ANOVA followed by Bonferroni test for post hoc comparison and are presented as the means ± SEM. *P < 0.05. d Representative photographs of macroscopic features of aneurysms in the ApoE−/− mice. AngII, AngII (1000 ng/kg/min) infusion for 4 weeks plus water gavage; AngII + NGN, AngII infusion plus naringenin gavage (50 mg/kg/day). The right panel shows the incidence of AAA in the ApoE−/− mice and quantification analysis of the maximal suprarenal aorta diameter by ex vivo measurement. The incidence of AAA was analyzed using the chi-square test. The maximal suprarenal aorta diameter was analyzed using an unpaired t test and is presented as the means ± SEM (n = 12 mice for each group). *P < 0.05.

