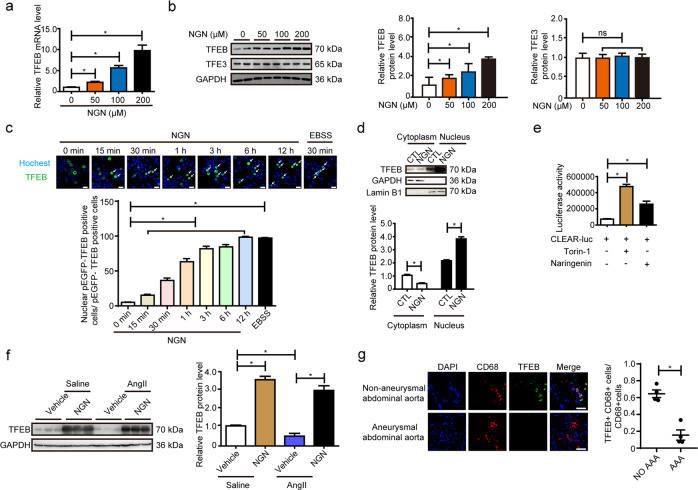
Fig. 4. Naringenin promoted macrophage TFEB activation.
a RT-qPCR validation of TFEB in macrophages stimulated with naringenin (0, 50, 100, 200 µM) for 12 h. The data were analyzed using one-way ANOVA followed by Bonferroni test for post hoc comparison and are presented as means ± SEM of six independent experiments. *P < 0.05. b Western blot analysis of TFEB and TFE3 in macrophages after naringenin (0, 50, 100, 200 µM) stimulation for 12 h. The data were analyzed using one-way ANOVA followed by Bonferroni test for post hoc comparison and are presented as the means ± SEM of six independent experiments. *P < 0.05. c Transfection of 293 A cells with the pEGFP-N1-TFEB plasmid was followed by vehicle or naringenin (200 µM) stimulation for 15 min to 12 h or EBSS starvation for 30 min, and then, live-cell confocal analysis was performed to study the intracellular localization of TFEB. Hochest indicated the nucleus. The white arrow indicated the cells with TFEB in the nucleus. Scale bar, 25 µm. The data were analyzed using one-way ANOVA followed by Bonferroni test for post hoc comparison and are presented as the means ± SEM of six independent experiments. *P < 0.05. d Nuclear-cytoplasmic separation followed by western blot analysis of vehicle- or naringenin (200 µM, 12 h)-stimulated macrophages. The data were analyzed using two-way ANOVA followed by Bonferroni test for post hoc comparison and are presented as the means ± SEM of six independent experiments. *P < 0.05. e Luciferase activity assay of the HEK293A cells transfected with 2× CLEAR-luc plasmid and β-galactosidase (CMV-β-gal) (the internal control) after Torin-1 (10 nM, 12 h) and naringenin stimulation (200 µM, 12 h). The data were analyzed using one-way ANOVA followed by Bonferroni test for post hoc comparison and are presented as the means ± SEM of three independent experiments. *P < 0.05. f Western blot analysis and quantification of the protein levels of TFEB in the primary peritoneal macrophage cell lysates of the 12-week-old male ApoE−/− mice that underwent water or AngII (1000 ng/kg/min) infusion for 4 weeks with or without naringenin gavage (50 mg/kg/day). n = 3 for each group. The data were analyzed using two-way ANOVA followed by Bonferroni test for post hoc comparison and are presented as the means ± SEM. *P < 0.05. g Left, representative immunofluorescence images of TFEB (green) and CD68 (red) in human AAA arteries and control arteries. Right, quantification of the percentage of TFEB positive macrophages (CD68-positive cells). The data were analyzed using unpaired two-tailed Student’s t test and are presented as the means ± SEM. n = 4 for each group. *P < 0.05.

