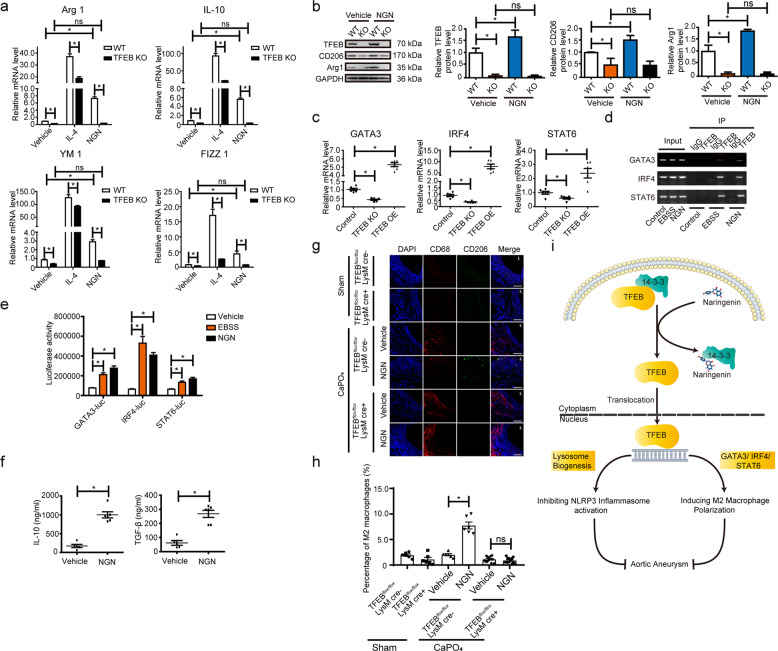
Fig. 8. Naringenin promoted macrophage M2 polarization via activation of TFEB.
a RT-qPCR validation of Arg1, IL-10, YM1, and FIZZ1 in the wild-type (WT) or TFEB knockout (TFEB KO) macrophages treated with vehicle, IL-4 (10 ng/ml, 12 h) or naringenin (200 µM, 12 h). The data were analyzed using two-way ANOVA followed by Bonferroni test for post hoc comparison and are presented as the means ± SEM of six independent experiments. *P < 0.05. b Western blot analysis and quantification of the protein level of the macrophage M2 polarization markers Arg1 and CD206 in the lysates of the wild-type (WT) or TFEB knockout (TFEB KO) macrophages treated with vehicle or naringenin (200 µM, 12 h). The data were analyzed using two-way ANOVA followed by Bonferroni test for post hoc comparison and are presented as the means ± SEM of six independent experiments. *P < 0.05. c RT-qPCR validation of GATA3, IRF4, and STAT6 in the wild-type (WT, TFEBflox/flox macrophages infected with Ad-GFP), TFEB knockout (TFEB KO, TFEBflox/flox macrophages infected with Ad-Cre), and TFEB-overexpressing (TFEB OE, TFEBflox/flox macrophages infected with Ad-TFEB) macrophages. The data were analyzed using one-way ANOVA and are presented as the means ± SEM of six independent experiments. *P < 0.05. d ChIP-qPCR analyses of the interactions between TFEB and promoters of three M2 macrophage polarization-driven genes. Formaldehyde cross-linked genomic DNA from the naringenin (200 µM, 12 h)- or EBSS (30 min)-treated BMDMs was reduced to fragment sizes of 180 bp to 330 bp via enzymatic digestion for immunoprecipitation. e Luciferase activity assays of the HEK293A cells transfected with the pGL3-GATA3-Luc plasmid, pGL3-IRF4-Luc plasmid, pGL3-STAT6-Luc plasmid, and β-galactosidase (CMV-β-gal) (the internal control) that underwent EBSS-induced starvation (30 min) or naringenin treatment (200 µM, 12 h). The data were analyzed using two-way ANOVA followed by Bonferroni test for post hoc comparison and are presented as the means ± SEM of six independent experiments. *P < 0.05. f ELISAs of the vehicle- or naringenin (200 µM, 12 h)-treated BMDM supernatants containing IL-10 (left) and TGF-β (right). The data were analyzed using unpaired t tests and are presented as the means ± SEM of six independent experiments. g Representative images of the immunofluorescence staining of CD68 (Red) and CD206 (green) in the aortas of 12-week-old male TFEBflox/flox mice and TFEBMφKO mice underwent sham operation or were periadventitially treated with CaPO4 followed by vehicle or naringenin (50 mg/kg/day) gavage for 7 days. L indicates lumen. h Quantification of the percentage of M2 macrophages (CD68+CD206+ cells) in the aortas of 12-week-old male TFEBflox/flox mice and TFEBMφKO mice underwent sham operation or were periadventitially treated with CaPO4 followed by vehicle or naringenin (50 mg/kg/day) gavage for 7 days. The data were analyzed using two-way ANOVA followed by Bonferroni test for post hoc comparison and are presented as the means ± SEM, *P < 0.05. n = 6–14 for each group. i Schematic illustration of the naringenin and TFEB activation in abdominal aortic aneurysm prevention and regression.

