
Figure 3.
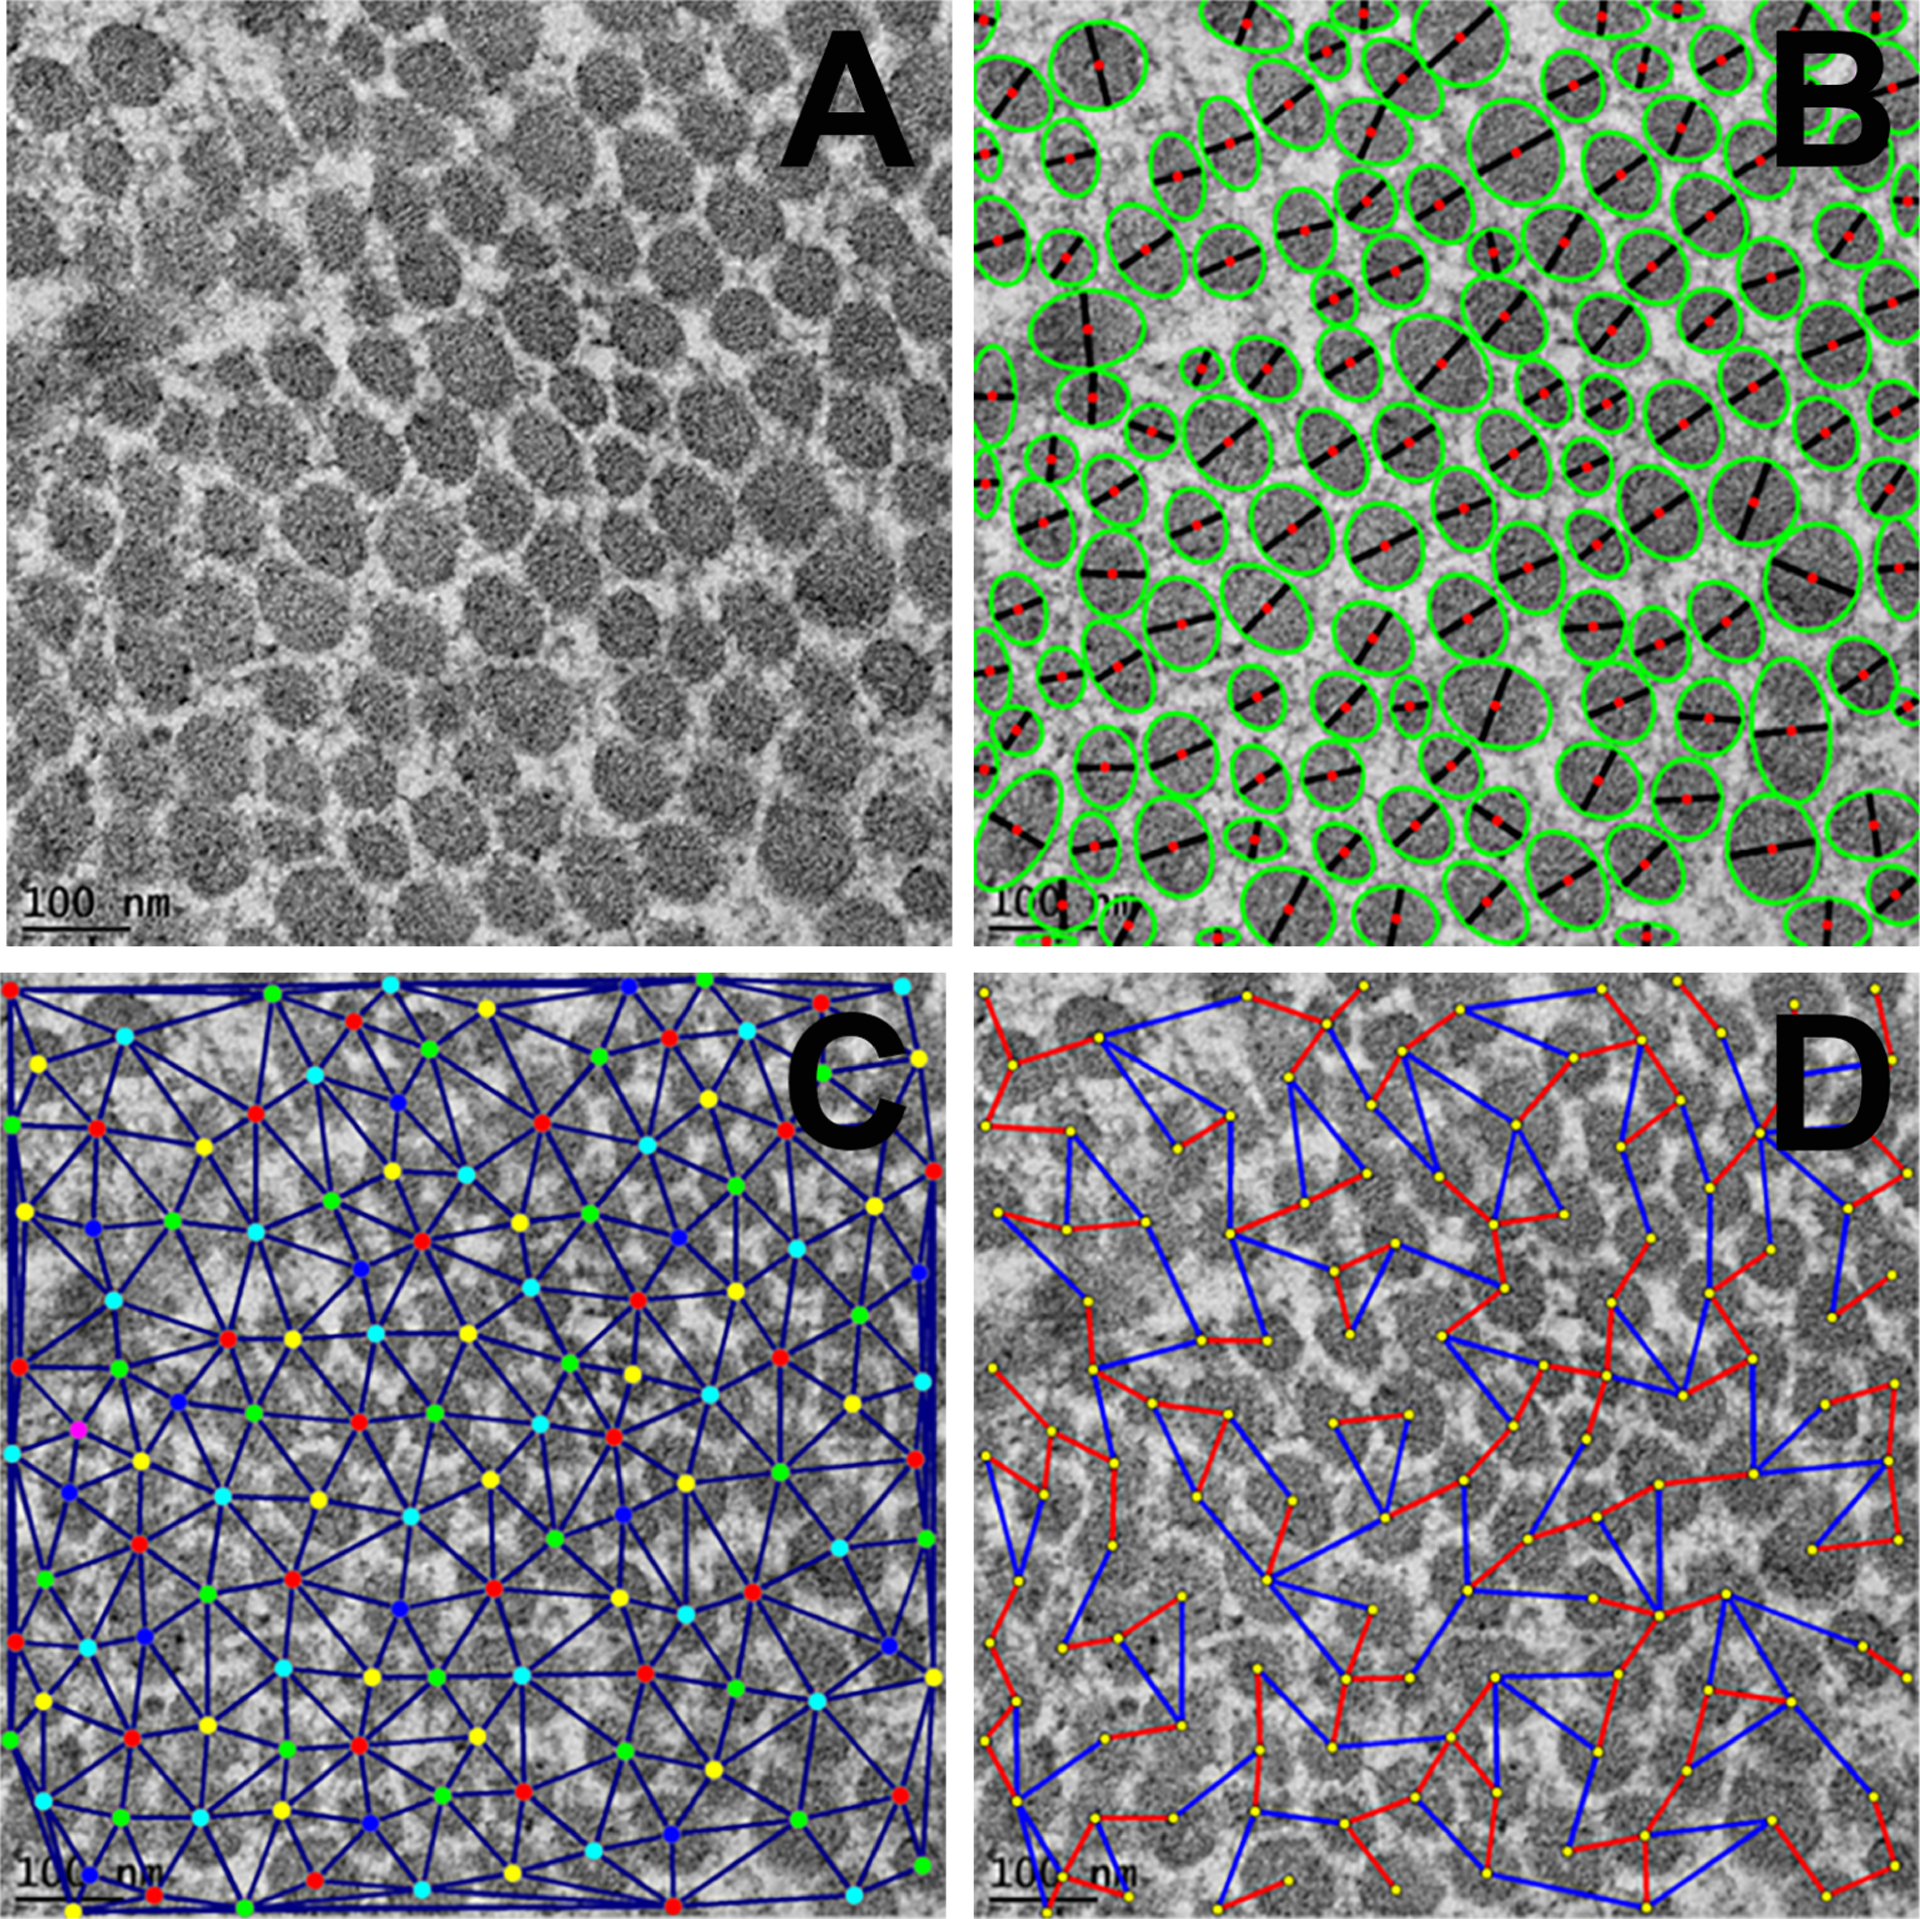
Representative TEM images of corneal tissue sections showing arrangement and pattern of fibrils in cross-sections at 25,000X magnification. A: unprocessed TEM image; B: processed TEM image showing segmentation for collagen fibrils (green: ellipses fitted to individual blobs (bead like structure), black: ellipse minor axes, red: blob centroids); C: processed TEM image showing fibril centroids and neighborhood and D: processed TEM image showing nearest (red) and farthest (blue) inter fibril distances (IFD). Scale bar = 100 nm.