
Figure 8.
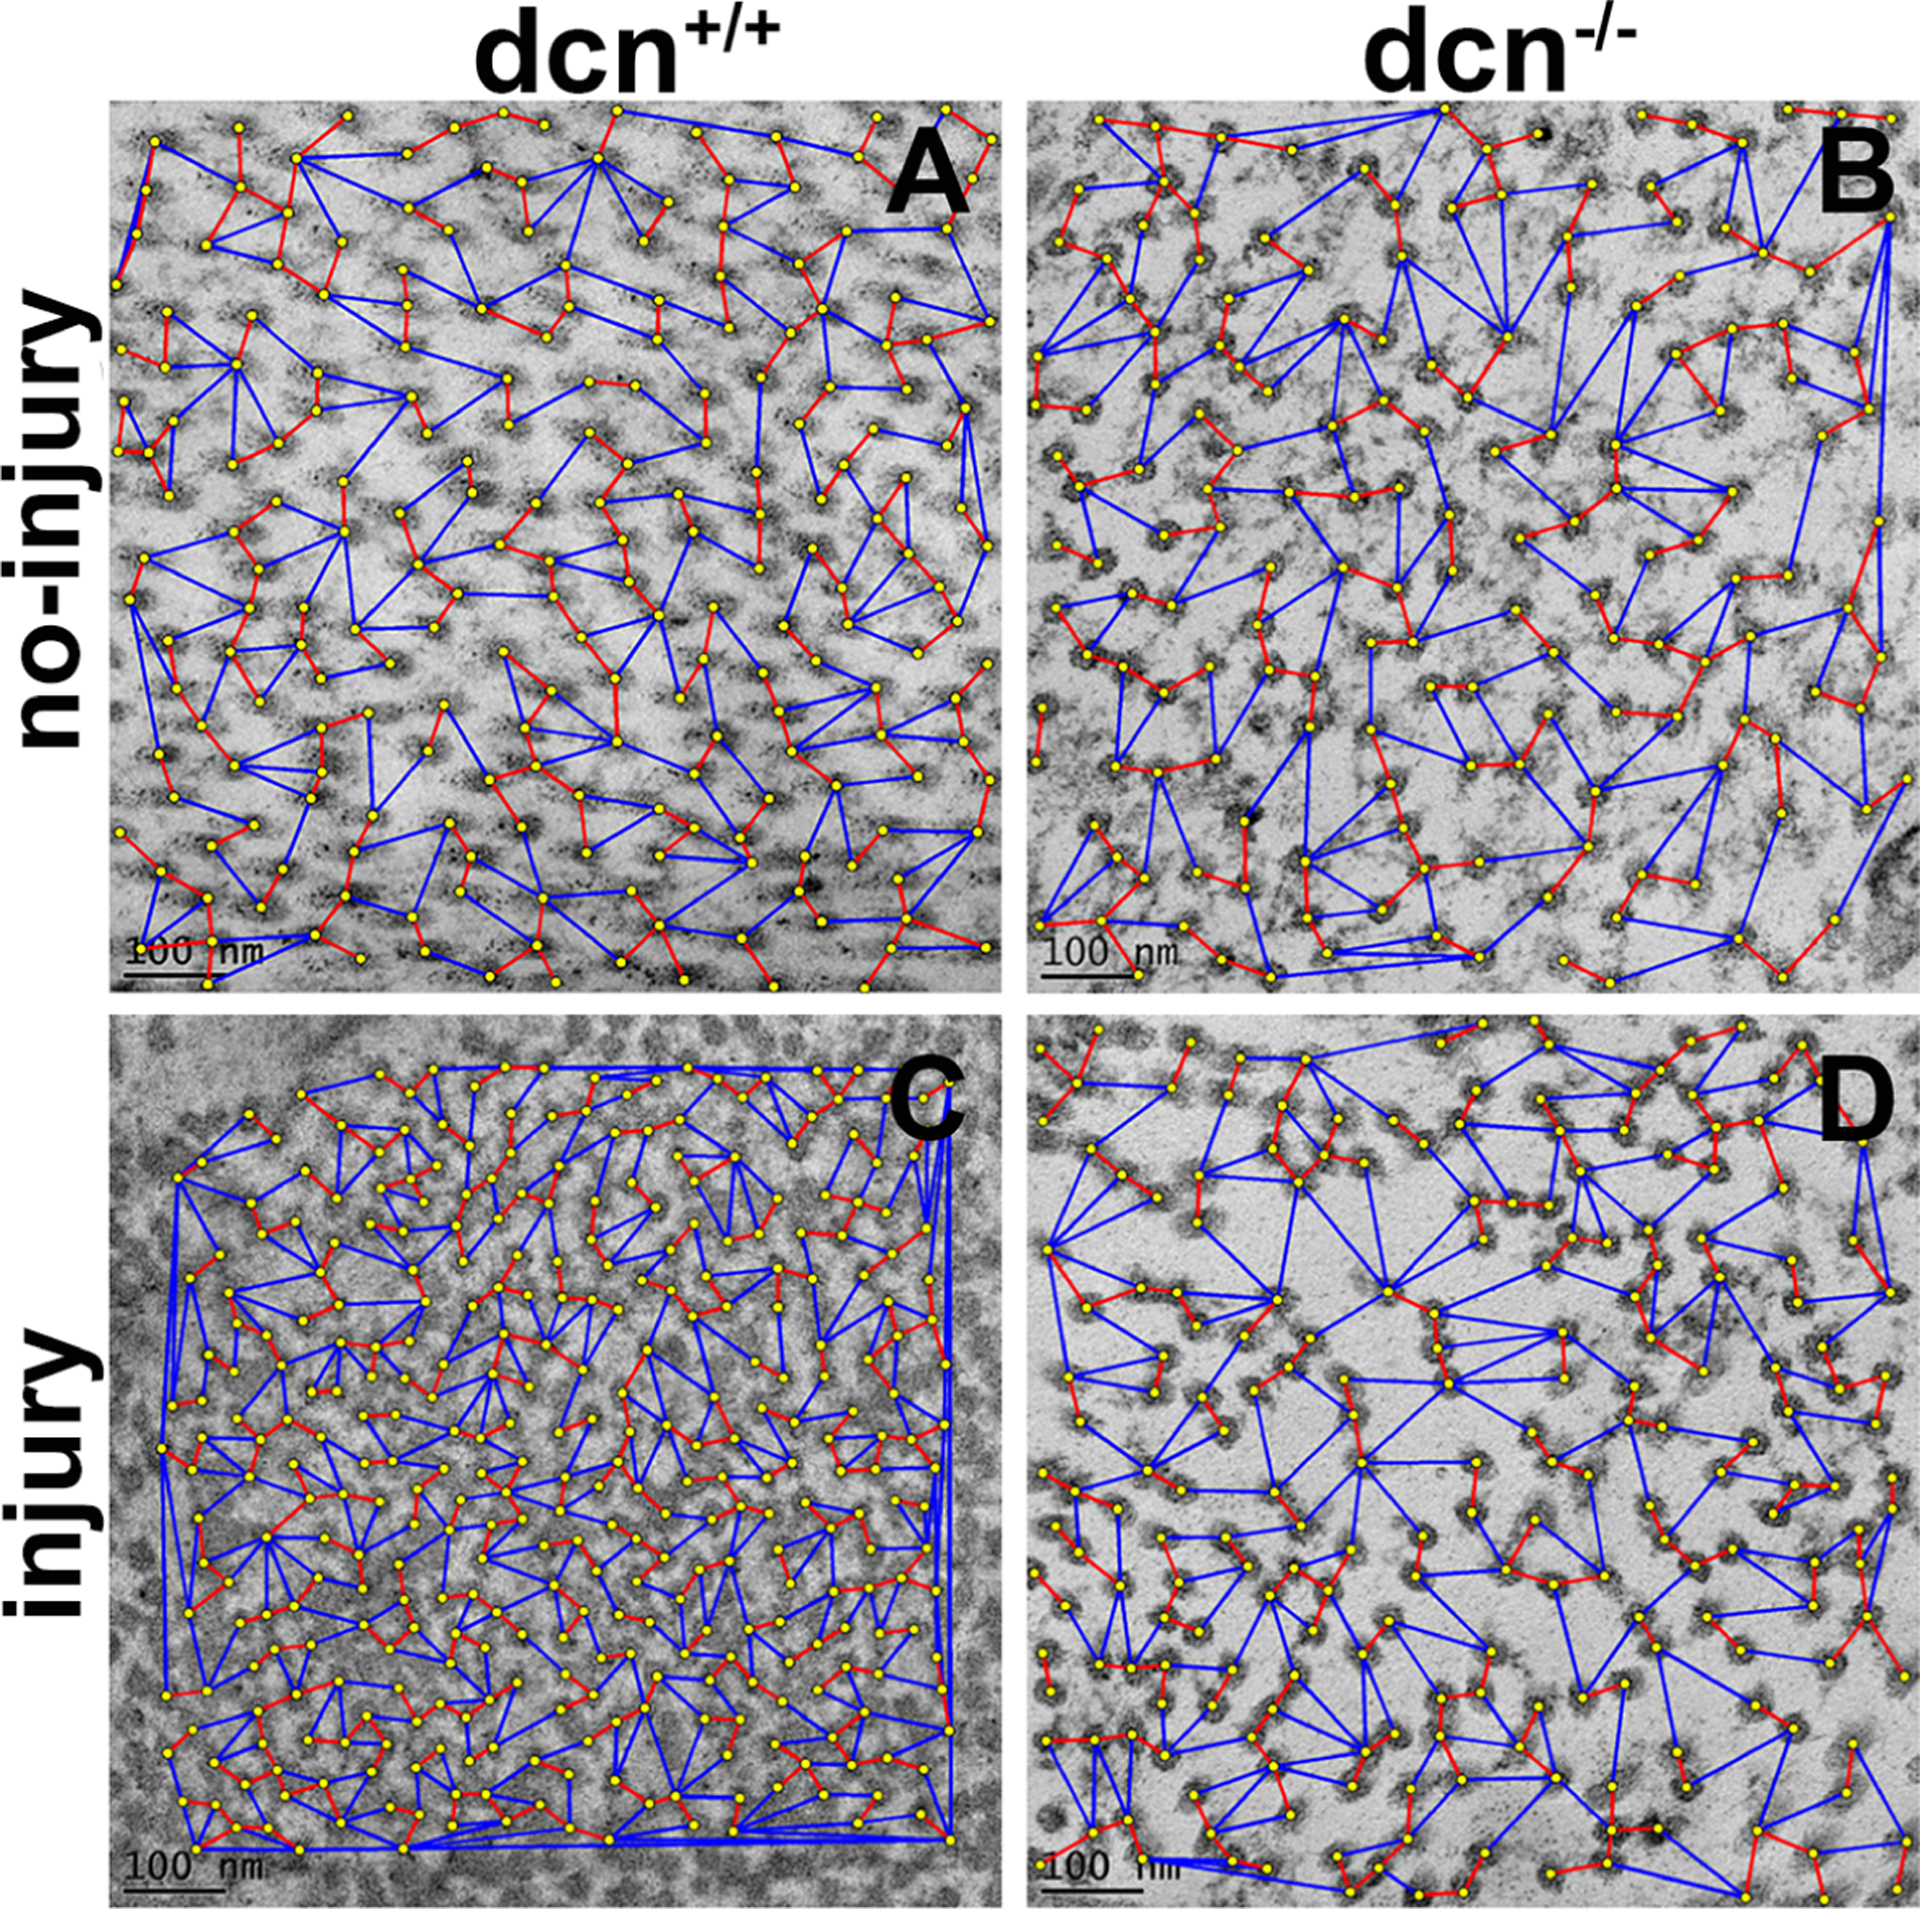
Representative TEM images showing organization and distribution pattern of fibrils in stroma at day 21 in no-injury and post-injury dcn+/+ and dcn−/− mouse corneas. The minimum IFD is shown by red lines and maximum IFD by blue lines. Injured dcn−/− corneas (D) showed largest minimum and maximum IFDs compared to the dcn+/+ corneas (C). Uninjured dcn+/+ (A) and dcn−/− (B) corneas showed unremarkable changes in IFDs. Scale bar = 100 nm.