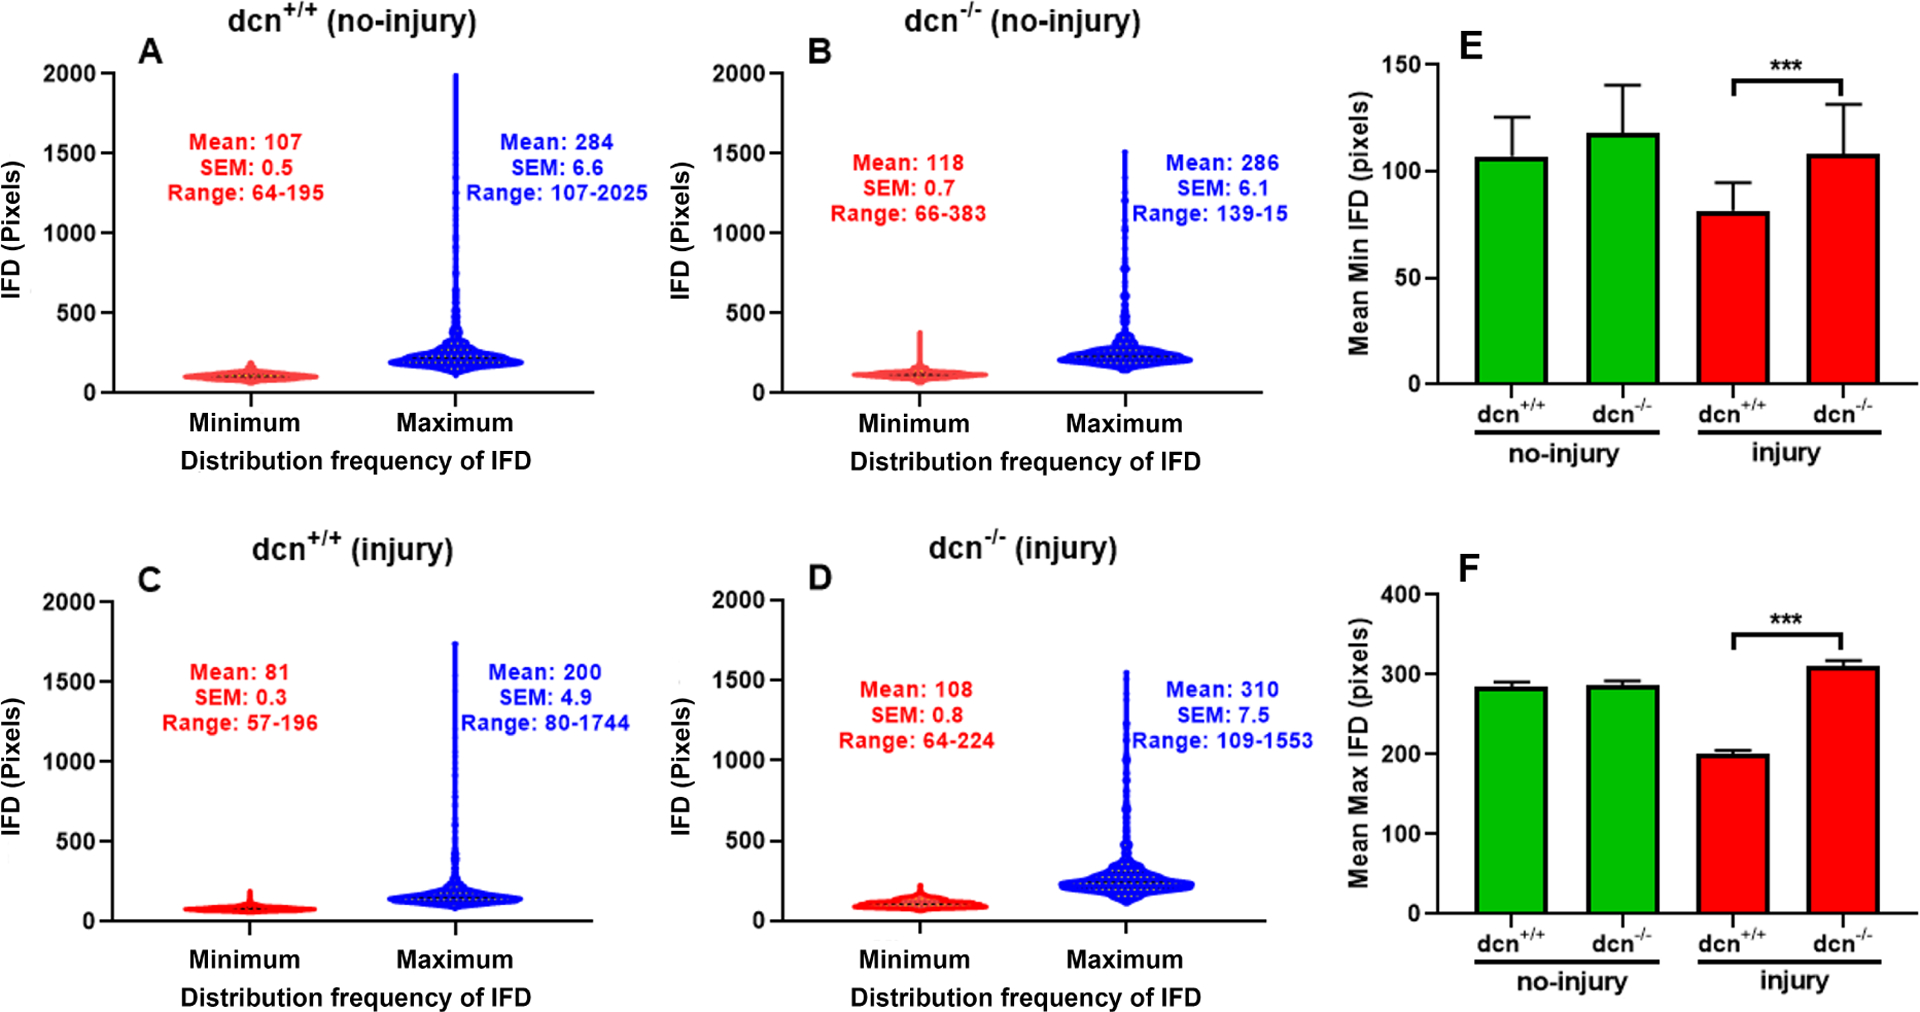
Figure 9.

Violin graphs show inter fibril distances (IFD) and distribution frequency of IFD in stroma at day 21 in no-injury and post-injury dcn+/+ and dcn−/− mouse corneas. In violin graphs, minimum IFD is drawn in red color while maximum IFD in blue color. Injured dcn−/− corneas (D) showed prominent differences in minimum/maximum IFDs and its distribution frequency compared to the dcn+/+ corneas (C). These differences were unremarkable in uninjured dcn+/+ (A) and dcn−/− (B) corneas. Quantification found minimum (E) and maximum (F) IFDs significantly different in dcn−/− compared to the dcn+/+ corneas post injury. Data were expressed in ± SEM and ***P < 0.001.
