
Figure 8. Mice display distinct sex differences in inflammatory profile at 3d post-injury.
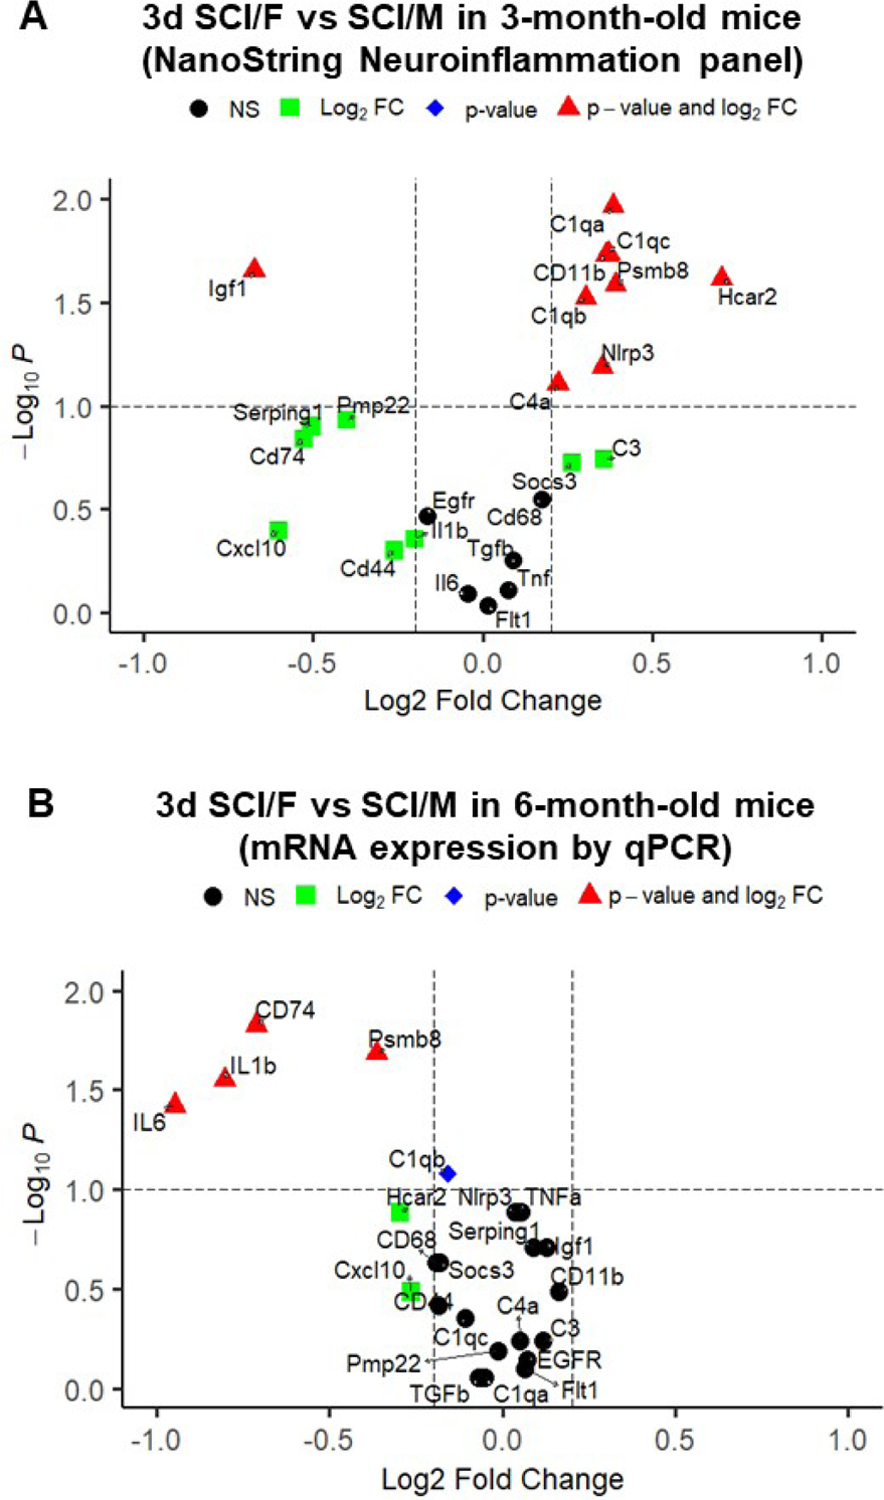
(A) Volcano plot of select differential expressed genes derived from SCI/Female vs. SCI/Male pairwise comparisons in NanoString data of young adult mice (3-month-old). n=3–4/group. (B) Six month-old male and female mice were subjected to SCI and injured spinal cord tissue was collected at 3 d post-injury and processed for RNA extraction and a list of inflammatory genes was examined by qPCR analysis. Linear fold change (FC) and p-values derived from t-test were transformed into Log2FC and Log10(P-value), respectively and presented as Volcano plot. Black circle=not significant (NS); Green square=Log2(Fold change)>0.25; Blue diamond=Log10(P-value)>1; Red triangle=Log2(Fold change)>0.25 and Log10(P-value)>1. n=8/group.